Using Alerts Summary
Learn how to view and monitor alerts for a specific service or subsystem.
On this page:
Introduction
The Alerts Summary section provides an aggregate view of the alerts that have been logged by Policy Manager including type, date, severity, and status.
- Each line item in the summary represents not a single alert, but rather all of the logged alerts for a specific system or component.
- You can also configure the system to monitor specific components using the Monitor Components function.
Location: In the Policy Manager Management Console, go to Alerts > Alerts Summary.
Service Performance Indicators
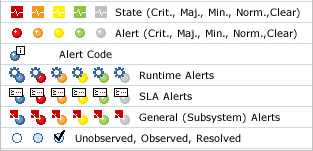
The My Dashboard page illustrates the service performance using Status icons. Icons utilize a color coding scheme to indicate severity and are categorized based on the Policy Manager entity they are associated with (Runtime, SLA, or General Subsystem).
Monitor Components
Monitor one or more individual component in near-real time.
- Go to Alerts > Alerts Summary.
- Check the Component Name check-box for the component or components you wish to monitor.
- Click Monitor Components. The Monitor Components screen is displayed.
- Set the period at which you want the screen to automatically refresh:
- The minimum value is five (5) seconds
- Each time the screen refreshes, you can see any new alerts that have been logged for the displayed component(s)
- Click Cancel to exit.
Alert Summary Field Descriptions
The following table provides a list of field descriptions that represent all the elements that can be monitored for a selected service or subsystem.
| Column | Description |
|---|---|
| Component | Displays the name of the affected component |
| State | Displays the aggregated state of the component |
| Last Alert Date | Displays the date of the most recently logged alert |
| Total | Displays the total number of alerts in the database |
| Critical, Major, Minor, Normal | Displays the number of alerts that are Critical, Major, Minor, and Normal |
| Open | Displays the number of unresolved (open) alerts |
| Observed | Displays the number of observed alerts |
| Resolved | Displays the number of resolved alerts |