API Gateway Analytics
Learn how to use the Akana MongoDB Support plugin to enable MongoDB support, allowing the Gateway to generate analytics from governed messages and capture the analytics data into a NoSQL data warehouse. The Envision product also uses this plugin.
On this page:
- Overview
- Plugin Architecture
- Deployment Architecture
- Installation
- Upgrading Aggregation Criteria using an Automation Recipe
- Usage/Enhancements
- Use Case—Point of Sale Metrics for Shoe Retailer
Overview
The API Gateway can collect a wide range of data that can be analyzed with the help of the Envision analytics platform. This collaboration is enabled through a set of plugins for each products that provide cross-over functionality that enhance each product's experience. The list of capabilities provided by the plugins are as follows.
- Configuration of an operational metrics dataset, charts, and dashboards in Envision.
- Population of the operational dataset in Envision from messages processed by the API Gateway.
- API Gateway controlled security (authorization) for operational data in Envision.
- Population of user created datasets in Envision from messages processed by the API Gateway.
- SLA enforcement for user created dataset metrics.
There are three plugins that together provide these capabilities: one for the Network Director, one for the Policy Manager Console, and one for Envision. This document describes the plugins including their architecture, installation, and configuration.
Plugin Architecture
The Envision analytics platform analyzes data received from data feeds generated by analytics connectors. An analytics connector will extract data from a business system and feed the data to Envision using an Envision API. The following is a picture of how Envision interacts with users and other systems. Note the use of a Connector to collect information from a business system and feed it to the Envision platform.
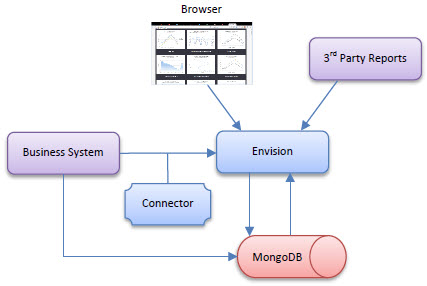
The API Gateway product provides an analytics connector that will feed metrics collected from APIs and services that it manages. In the picture above the API Gateway is a Business System feeding Envision.
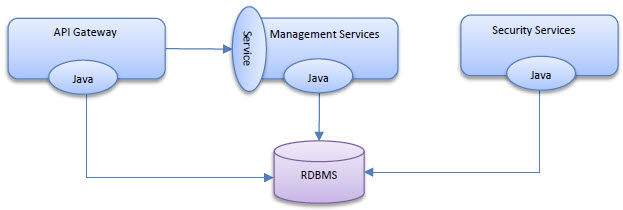
The API Gateway provides metrics collection and aggregation capabilities out-of-the-box. It only does so for a limited set of metrics with predefined dimensions. There are two ways these metrics are collected and persisted in the API Gateway:
- Via a metrics collection service included in the Akana Management Services feature. This provides a remote API that the Network Director can deliver metrics through.
- Via a metrics reporting Java API which all Policy Manager provided services and APIs used to report their metrics. The Network Director can use this API as an alternative to using the remote API.
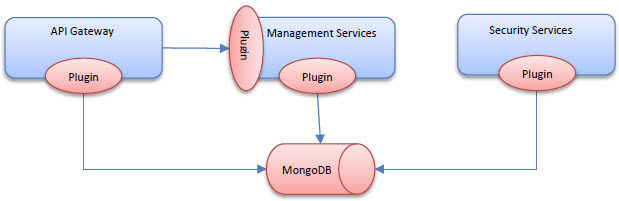
When the Envision plugin is installed with the Policy Manager features the Java API used for reporting metrics is overridden with one that writes those metrics to the MongoDB NoSQL database Envision uses. This Java API override also replaces the remote API's implementation so any metrics delivered remotely from the Network Director are also written to the NoSQL database. When the analytics plugin is installed with the Network Director the Network Director can then also write directly to the NoSQL database as an option.
Envision supports analyzing data from any source, any domain, only relying on user defined metadata describing a set of data (dataset) and how the data should be processed. The Envision plugin introduces a new policy, the Business Metrics policy, that will instruct the Network Director how to extract data from managed API/service messages that can then be fed into Envision to fill datasets created by users.
The Business Metrics policy handler supports a variety of data extraction mechanisms, including XPath, JSONPath, RegEx, and script-based expressions. Based on the policy configuration a multitude of these mechanisms may have to be used to extract data from each message processed by the Network Director. To avoid adding latency to the delivery of each message the policy handler will extract data from a message in a separate thread.
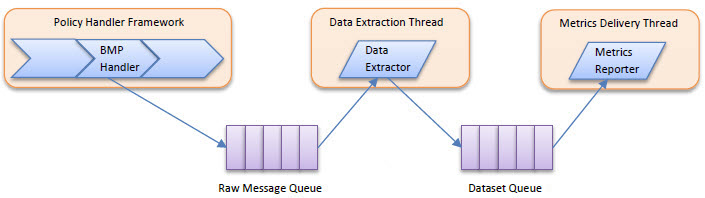
Based on the needs specified in the Business Metrics policy the Business Metrics policy handler will copy portions of the request/response/fault message (headers, body) to the Raw Message Queue along with instructions on how data should be extracted. The Data Extractor executes in the Data Extraction Thread pulling the records from the Raw Message Queue, extracting the data, and placing the extracted data in the Dataset Queue. The Metrics Reporter executes in the Metrics Delivery Thread calling the API for persisting the extracted data.
The API Gateway supports using MongoDB as a metrics store using the MongoDB plugin. The Envision plugins automatically install the MongoDB plugin so that all metrics, including metrics collected by the Business Metrics policy, are stored in the MongoDB NoSQL database. That means all administration (viewing, exporting, archiving) of metrics will be performed against the MongoDB database. This also mean that all SLA calculations will be performed using the MongoDB database. This is achieved by replacing the Evaluator module of the SLA Engine. The SLA Engine modules are illustrated in the diagram below.
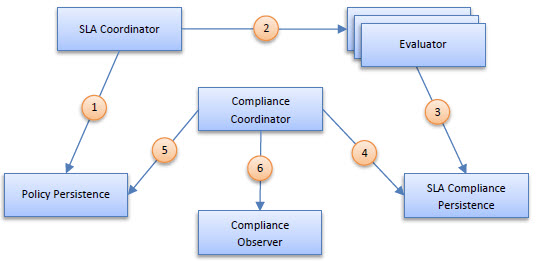
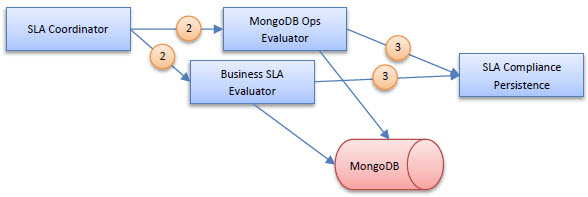
When using the MongoDB database the Evaluator module, which evaluates whether SLAs are violated, is swapped out with a module that not only can query for information from MongoDB but will actually use the power of MongoDB to perform calculations using the MongoDB processor itself. This frees up computing resources for the Policy Manager process. In addition, an evaluator for SLAs based on business metrics is introduced. This evaluator will also use MongoDB. The following diagram illustrates the addition of the two MongoDB based evaluators.
Not all the plugins used in the integration of the API Gateway with Envision change the behavior of the API Gateway. An API Gateway plugin is also installed on the Envision analytics platform which provides integrated security (authorization) around the access to records in datasets. By default Envision secures data in datasets based on the owner's shared settings on the dataset. Optionally datasets created by different business systems such as the API Gateway can be protected through the use of a security plugin.
Each dataset in Envision can optionally reference a security provider. That provider is consulted when the data queries are performed in Envision.
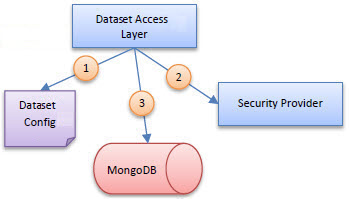
The Dataset Access Layer in Envision first consults the Dataset configuration to identify a Security Provider (if any). It then consults the Security Provider providing the provider contextual information about the data access request. The security provider then providers additional filter criteria that when added to the query of MongoDB will filter out records that should not be accessible. By translating security permissions into a NoSQL query security can be enforced in a highly efficient way by the NoSQL server instead of filtering out records in memory.
The API Gateway plugin for Envision will create a Security Provider for the operational metrics dataset it installs in Envision. The filter created is based on the user's access to the API/services the operational metrics are collected for. A user who does not have access to an API in the Policy Manager console for example will not have access to data in the operational metrics dataset for that API regardless of how a chart is configured.
Deployment Architecture
The API Gateway and Envision are two different products, but they both are deployed using the Akana Platform. Therefore they can be deployed separately or together. The following section will describe a few options for deploying the two products together. In all deployment options the MongoDB NoSQL database is depicted as a single object however it can be clustered, sharded, and scaled in multiple ways which is out of the scope of this document.
In this section:
Separate Containers
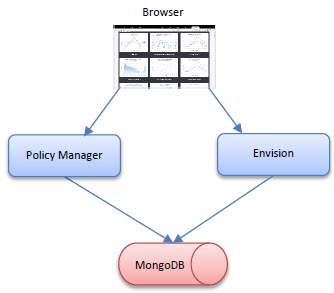
In this deployment Policy Manager and Envision are installed on two completely separate containers. They each will have their own HTTP host and/or port when accessing the two consoles from a browser. Each container will access the same MongoDB NoSQL database. Each product can be scaled independently.
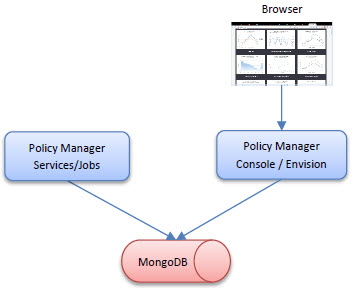
Shared Consoles
In this deployment the Policy Manager services and jobs will be installed on separate containers from the Policy Manager Console and Envision. Since both the Policy Manager Console and Envision features are driven primarily by end-user interaction they may share more common scaling demands then those of the Policy Manager jobs and services which are driven by a scheduler and Network Director interaction. Scaling can then be accommodated differently for web traffic than back-end traffic. In this deployment both the Policy Manager Console and Envision can share the same host and port. Both containers would still access the same MongoDB NoSQL database.
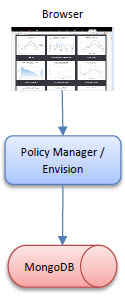
All-in-One
In this deployment the Policy Manager Console, Services, Jobs, and Envision are all installed on the same container. This deployment offers the least flexibility in scaling options but is the simplest deployment for small scale environments.
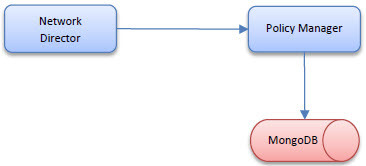
Remote Metrics Collection
In this deployment the Network Director will report the metrics it collects to the Policy Manager through a remote API. The Policy Manager will access the MongoDB NoSQL database. The Network Director will not require a route to the MongoDB database.
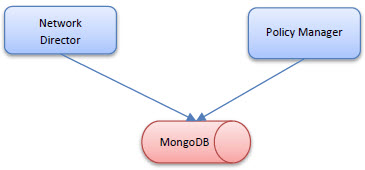
Direct Metrics Collection
In this deployment the Network Director reports the metrics it collects directly to the same MongoDB NoSQL database that the Policy Manager (and Envision) accesses.
Installation
A set of plugins are provided that provide the analytics connector and security plugin capabilities. These plugins act as a bridge between the API Gateway (Policy Manager) and Envision products. In order for them to function properly, the Policy Manager, Envision, and PM Analytics Plugin repositories need to be installed in the same root Akana directory. To do this you must download and unzip the Envision, Policy Manager, and PM Analytics Plugin zip files in the same location. The resulting directory structure should resemble the following:
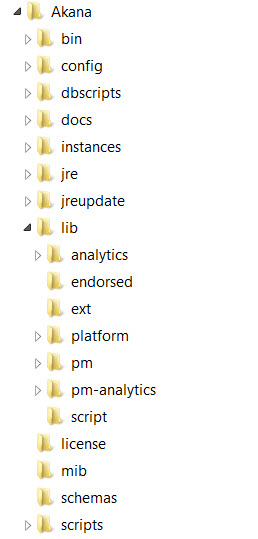
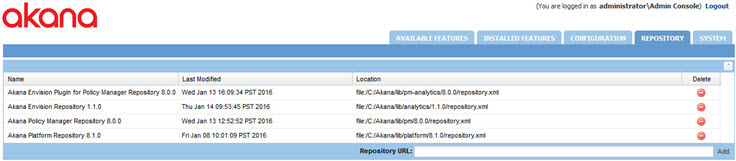
Note the pm, analytics, and pm-analytics directories in the lib directory. When viewing the repositories in the admin console of an Akana container (process) you should see both repositories, as seen below.
The plugins needed for product integration are as follows:
- Akana MongoDB Support—This plugin is installed automatically when installing the Akana Envision Policy Manager Console Extensions or the Akana Envision Policy Manager Service Extensions plugins. It is not installed automatically by the Akana Envision Metrics Collector plugin which uses the remote metrics reporting API by default. It can however be installed on a container with the Network Director feature to enable direct storage to a MongoDB NoSQL database instead of using the remote API.
- If you are using Akana Envision—the Envision plugins. For more details, refer to the Envision documentation: Envision Plug-Ins. Summary info below:
- Akana Envision Metrics Collector—See, Akana Envision Metrics Collector.
- Akana Envision Policy Manager Console Extensions—See, Akana Envision Policy Manager Console Extensions.
- Akana Envision Policy Manager Service Extensions—See, Akana Envision Policy Manager Service Extensions.
- Akana Policy Manager Security Provider for Envision—See, Akana Envision Policy Manager Service Extensions.
Note: There is an additional, optional plugin for Envision, the Akana Sample Datasets for Demo Charts, that installs sample datasets for use in the Envision Console. See, Using the Akana Sample Datasets for Demo Charts Feature.
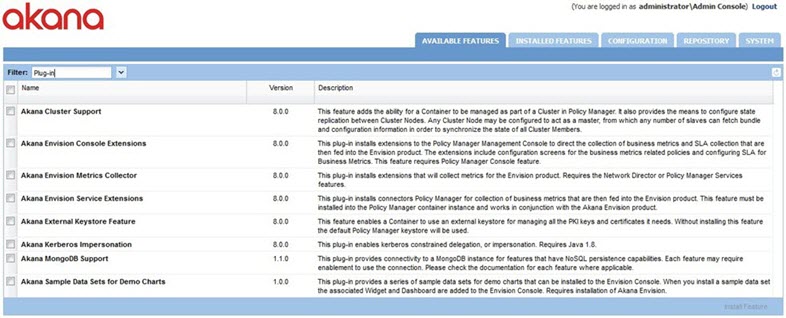
The plugins should all be available in the Available Plug-Ins page.
Determining which container to install a plugin on depends on which deployment architecture you are following (see, Deployment Architecture). The key is that each plugin supports certain features as noted above and that the plugins need to be installed on the same container as the supported feature. The configuration of the Akana MongoDB Support plugin is described below. For information on the Akana Envision plugins, refer to the Envision documentation: Envision Plug-Ins.
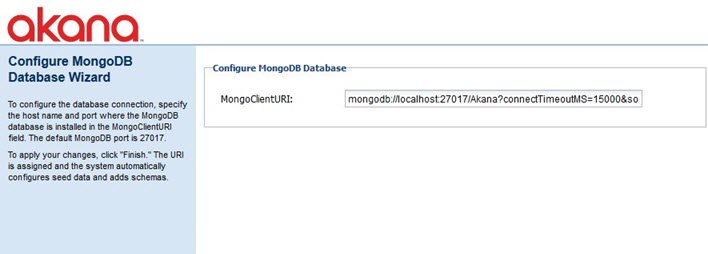
Akana MongoDB Support Plugin
This plugin has only one configuration setting, the URI of the MongoDB database. This URI includes the host and port of the database server as well as the database name in the path. By default the name of the database installed for all Akana products is SOA.
If the plugin is installed with the Network Director feature writing directly to the MongoDB database will require the usage.local.writer.enabled configuration option in the com.soa.monitor.usage configuration category to be set to true, as shown below.
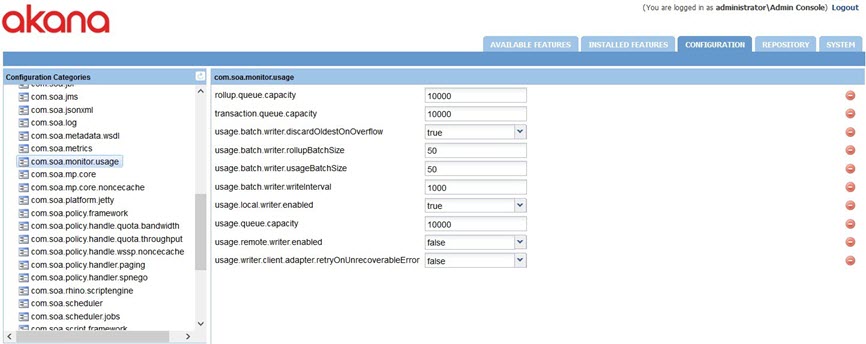
Akana Administration Console Configuration Settings for MongoDB
This section includes information on the settings you might need to review or adjust for MongoDB management.
Configuration category: com.soa.persistence.mongodb
- persistence.mongodb.async.thread
- The number of threads allocated for processing asynchronous requests.
- persistence.mongodb.autoinstall
- Allows you to enable or disable automatic installation of seeders.
- Default: false.
- persistence.mongodb.enabled
- Allows you to enable or disable use of MongoDB as NoSQL persistence database.
- As long as you are using MongoDB, do not change this setting. The platform default, when MongoDB is not in use, is the RDBMS.
- persistence.mongodb.mapReduceMaxExecTime
- The maximum execution time for a MapReduce job to run (in minutes). If maximum execution time is exceeded, the job aborts, and must be recovered by the recovery job.
- Note: We recommend a long timeout value, such as the default 10 minutes. It's best to have a scenario where the maximum execution time is never exceeded. If you are experiencing timeouts, you can adjust the setting to either reduce the maximum batch size or increase the execution time. For a long-term traffic increase, the best solution is to add additional MongoDB shards to share the load.
- Default: 10 minutes.
- persistence.mongodb.mongoClientURI
- Provide the seed list of host and IP addresses for query routers for fault-tolerance. For more information, refer to the driver documentation.
- Example: mongodb://mongos1:27017,mongos2:27017,mongos3:27017/Akana?connectTimeoutMS=15000&socketTimeoutMS=1500000&minPoolSize=0&maxPoolSize=100&waitQueueMultiple=5&waitQueueTimeoutMS=10000
- This is the URI format for defining connections between applications and Envision MongoDB instances. Optional parameters:
- authSource—An authMechanism must be configured if the user wants to enable MongoDB's access control.
- connectTimeoutMS—The time in milliseconds to attempt a connection before timing out.
- socketTimeoutMS—The time in milliseconds to attempt a send or receive on a socket before the attempt times out.
- minPoolSize—The minimum number of connections in the connection pool.
- maxPoolSize—The maximum number of connections in the connection pool.
- waitQueueMultiple—A number that driver multiples the maxPoolSize value to provide the maximum number of threads allowed to wait for a connection to be available from pool.
- waitQueueTimeoutMS—The maximum time in milliseconds that a thread can wait for a connection to become available.
- Provide the access control details in case the MongoDB instances are running with auth flag enabled.
- The following example shows the access control mechanism for SCRAM-SHA1: mongodb://{username}:{password}@localhost:27017/Akana?authSource=admin&authMechanism=SCRAM-SHA-1&connectTimeoutMS=15000&socketTimeoutMS=1500000&minPoolSize=0&maxPoolSize=100&waitQueueMultiple=5&waitQueueTimeoutMS=10000.
- persistence.mongodb.password
- The password for connecting to the MongoDB database.
- persistence.mongodb.rollup.maxBatchSize
- The maximum number of raw records that can be rolled up in one batch.
- persistence.mongodb.rollup.maxRecoveryBatchSize
- The maximum number of raw records in a batch, for a recovery job.
- persistence.mongodb.rollup.skipRecoveryIteration
- The number of iterations to skip before running the recovery jobs. Use zero (0) to run recovery after every rollup, use negative one (-1) to never run.
- persistence.mongodb.rollup.strategy
- The strategy for rollup of MongoDB data. The only option is Map/Reduce. For more information, see Managing the Map/Reduce maxBatchSize Settings.
- persistence.mongodb.username
- The username for connecting to the MongoDB database.
Note: There are two ways to view the failed job statistics if a recovery job fails by using the following method:
-
Log Immediate: This recovery method logs recovery job statistics upon failure, which includes the total number of recovery job failures, sequential recovery job failures, and the number of iterations until the next recovery job tries to run.
-
Query then Log: This recovery method logs recovery job statistics upon failure, which includes the records that are pending for recovery analysis or roll-up.
To optimize an index for recovery job performance, use OPERATIONAL_METRICRawIdsIDX and OPERATIONAL_METRICRecoveryIDX index.
Managing the Rollup maxBatchSize Settings
Valid in Version: 2020.2.0 and later
This option lets you configure the size of the data chunk that MongoDB processes. The execution time varies according to the size and number of records to be processed. In general, it's a good idea to keep execution time below one minute.
As an administrator, it's helpful to be able to control the number of records that a Mongo MapReduce and Aggregation operation will attempt at any one time. If there is too much data for the MongoDB cluster to handle in one go, this could cause a crash or at least delay the processing of the information. In version 2020.2.0 and later, you can adjust the size of the batch size using the maxBatchSize configuration property.
If the batch size is too small for the throughput requirements of the deployment, the best solution is to add additional MongoDB shards to share the load.
For more information about the maxBatchSize property, see Troubleshooting.
Using the Aggregation Pipeline for data rollups
Valid in Version: 2022.1.0 and later
The option to perform data rollups using a MongoDB Aggregation Pipeline (requires MongoDB 4.2 or later). The Aggregation Pipeline rollup mechanism is the default.
The Aggregation Pipeline strategy for rollups is recommended to enable better performance and reduce server costs in maintaining the analytic rollups.
Notes about the MongoDB Aggregation Pipeline strategy for rollups:
- To reduce the memory footprint of the Mongo _id, the new Mongo Aggregation framework now compresses all the individual fields. The ContainerKey in the _id remains intact for sharding purposes. An example of what the _id might look like is shown below.
{ "containerKey" : "f5b1-622f-47b6-86ce-98893c4fe67f", "d" : "DAYSuddi:21d6f57e-0536-4c44-9971-3ddbf214039bf5b1-622f-47b6-86ce-98893c4fe67f71c8c68d-67f8-4c4b-826d-86990b216ca8:1022d670e64f-ea36-47da-b9f8-db58b5cfa6dduddi:ee179706-6579-45f4-9235-9fd589006019uddi:a3c3a083-808f-42df-b160-372b2da00ae61645142400000" } - It produces the same analytic results in both Community Manager and Envision.
- It supports the same error recovery scenarios implemented for the Map/Reduce strategy.
- It uses the same batching mechanism as the Map/Reduce strategy.
- It uses the same error recovery as the Map/Reduce strategy.
- The Aggregation setting will result in two sets of rollup data until the old documents with individual fields are purged.
Aggregation rollup strategy can be enabled via configuration settings in the Akana Administration Console. See, To select the Aggregation Pipeline strategy for MongoDB data rollups.
Note: MongoDB Server versions prior to 4.2—Map/Reduce rollup mechanism is the only option. For more information on the MapReduce database operation, see MongoDB documentation: Map-Reduce.
To select the Aggregation Pipeline strategy for MongoDB data rollups
- Install the product. For instructions, go to Install the Akana API Platform.
- Log in to the Akana Admin Console.
- Click the Configuration tab.
- On the left, under Configuration Categories, scroll down to find the com.soa.persistence.mongodb configuration category.
- In the persistence.mongodb.rollup.strategy field, select the default value to Aggregation.
- Click Apply Changes.
Upgrading Aggregation Criteria using an Automation Recipe
Valid in Version: 2022.1.3 and later
The envision-upgrade-to-aggregation.json automation recipe is used to migrate the Envision dataset rollup strategy from Map-Reduce to Aggregation in MongoDB. This recipe is part of the Envision bundle. Run this recipe after upgrading Akana to 2022.1.3. The recipe will update the aggregation pipeline configuration for all existing Envision datasets. After executing the recipe, all old datasets will get updated to use the aggregation pipeline configuration.
The content of the envision-upgrade-to-aggregation.json recipe is shown in the following code block.
{
  "name": "envision-upgrade-to-aggregation",
  "description": "Envision Upgrade To Aggregation",
  "phases": [
    "deploy"
  ],
  "bundles": {
    "install": [
      {
        "location": "obr://com.akana.analytics.recipe.handlers"
      }
    ]
  },
  "tasks": [
    {
      "name": "envision.upgrade.to.aggregation.task",
      "steps": [
        {
          "name": "envision.upgrade.to.aggregation.task.step",
          "properties": {}
        }
      ]
    }
  ]
}
Follow these steps:
-
Use the following script to remove aggregation criteria from the rollup configuration.
use Akana db.ROLLUP_CONFIGURATION.updateMany({"name":{$ne:"OPERATIONAL_METRIC"}},{$unset:{aggregationCriteria:1}}) -
Create the properties file by providing the following parameters, which are required to run the envision-upgrade-to-aggregation.json recipe.
INSTALL_DIR=abs:.. CONTAINER_NAME={container_name} -
Use the following command to run this recipe either on the PM or CM container.
./jython.sh -Dorg.slf4j.simpleLogger.logFile=System.out -m akana.container --recipe ../recipes/envision-upgrade-to-aggregation.json --props envision-upgrade.properties
Usage/Enhancements
As described earlier, there are plugins that enhance the API Gateway as wells as Envision. The following sections describe the enhanced user experience from the perspective of each product.
In this section:
- API Gateway Enhancements
- Business Metrics Policy
- Business Service Level Policy
- Operational Metrics Policy
API Gateway Enhancements
With the installation of the Envision plugins in the API Gateway business metrics collection and SLA enforcement can now be controlled through the use of two policies, the Business Metrics Operational Policy and the Business Service Level QoS Policy. This section will describe how these policies are used with detailed examples.
Business Metrics Policy
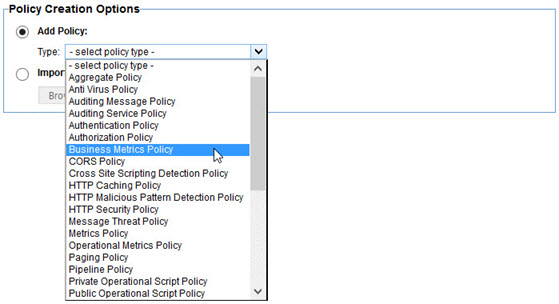
The Business Metrics policy provides instructions for extracting data from processed messages and mapping that data to fields in an Envision dataset. To create a Business Metrics policy, select the Business Metrics policy type in the first page of the Create Operational Policy wizard.
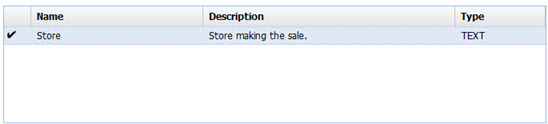
The Business Metrics policy editor is a multi-page wizard. On the first page you select the dataset you want to fill with the policy.
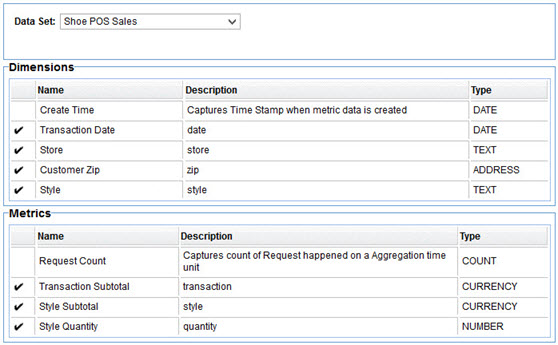
A pull-down at the top will display the public datasets created in Envision as well as the logged in user's private datasets in Envision (if any). The dimensions and metrics for the selected dataset are displayed in read-only tables to ensure the correct dataset is selected.
The next four pages provide instructions for the creation of structures, variables, dimensions, and metrics. Dimensions and metrics have been discussed already. A variable is a value that doesn't correspond one-to-one with a dimension or metric in the target dataset, but it can be used in an expression that will result in the creation of a dimension or metric. It can be used in multiple expressions in fact so it provides an opportunity for reuse and optimization by instructing the engine to perform a function once instead of repeatedly.
A structure models a sub-component of request or response message that may appear multiple times. For example if there are several items with their own properties that appear in a purchase transaction each item would be a structure. It is necessary to identify structures if dimensions or metrics are found in these sub-components and they need to be grouped together for aggregation. For example if each item in a purchase has a type and a price, in order for the aggregation engine to sum prices by type price cannot be collected without associating it to, or grouping it with, the type.
All four pages are organized in a similar way and provide similar capabilities. A table at the top of the page identifies the items being populated, structures, variables, dimensions, or metrics. For dimensions and metrics those tables are static as the rows are populated from the dataset definition in Envision. Structures and variables on the other hand can be added and removed.
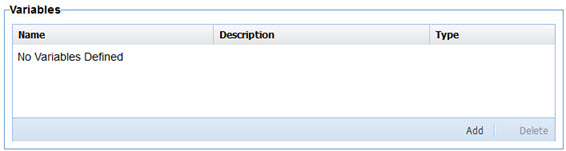
To create a variable, select Add from the Variables table.
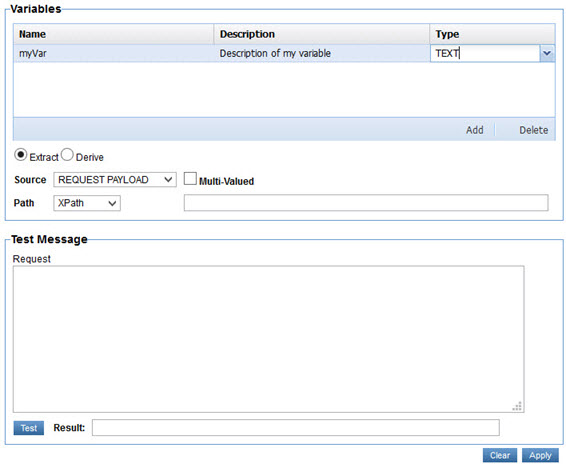
A new row will be added in the table. Each cell of the row is editable. The Type cell is a pull-down of the variable types supported which correspond to the types supported for metrics and dimensions by Envision.
Structures do not have a type. Instead they are mapped to Groups defined in a Dataset.
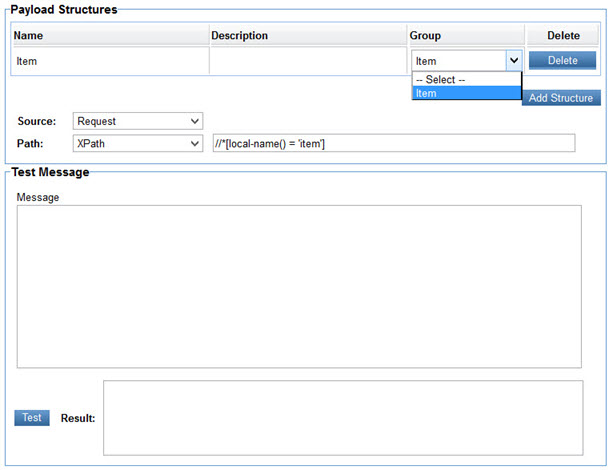
The Group column in the Payload Structures table holds a pull-down populated with all the Groups identified in a Dataset. The user selects a Group in the pull-down to associate the structure with the Group.
When any row of the target tables (structures, variables, dimensions, metrics) are selected the page is expanded to include options for how to extract or derive the value for the item identified by the selected row. Those options will described in more detail below. When finished configuring those options select Apply on the bottom right of the page. A checkmark will be displayed to the left of the item's row indicating its value has been defined.
To start over again with those options select Clear. To delete a variable select the row identifying the variable to delete and select Remove.
For any selected item in a target table (variable, dimension, metric) its value can be generated by either extraction or derivation as identified by the Extract and Derive radio buttons.
Value Extraction
Value Extraction is the act of filling the value of a targeted item (structure, variable, dimension, variable) with data found in the exchange of messages between a client and an API/service. To extract data from the message exchange we must first identify the source of the extraction. This is identified using the Source pull-down. The options are:
- Request Payload—Body of the message sent by the client.
- Request Header—Header of the message sent by the client
- Response Payload—Body of the message returned by the service.
- Response Header—Header of the message returned by the service.
- Fault Payload—Body of the fault message returned by the service.
- Fault Header—Header of the fault message returned by the service.
- Form Parameter—Form parameter in the request message if form encoded.
- Path Parameter—Path parameter in the requested URL as defined in the service's metadata.
- Query Parameter—Query parameter in the requested URL.
- <Structure>—Each structure defined on the Structures page will appear as an option in the Source pull-down. When selecting the structure as the source any expressions used to dictate how to extract the variable, dimension, or variable will be performed within the context of the structure. If multiple structures are found while executing the policy the expressions for extracting variables, dimensions, or variables will be executed for each structure found producing multiple results.
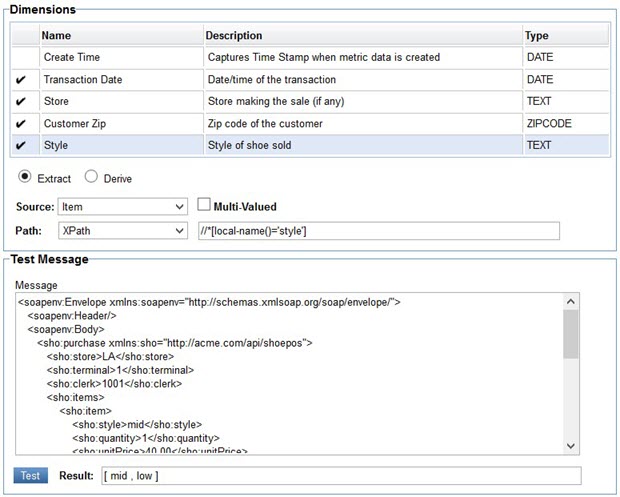
Only Request Payload, Response Payload, and Fault Payload are available when defining a structure. When extracting data from a payload, request, response, or fault, you specify a path to, or location of, the value you want to extract from the payload content. This path is described using either XPath for XML payloads, JSONPath for JSON payloads, or RegEx for any payload as selected from the Path pull-down.
You then enter the path using the selected path language in the text box to the right. As a convenience a text area where you can paste a sample message payload is provided below and a Test button so that you can verify the path you enter will return the correct information.
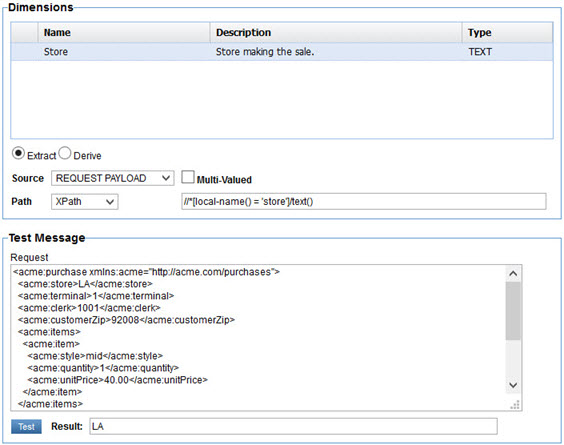
In the illustration above we have chosen to fill the Store dimension with the text from the store element in the Request Payload using XPath.
In some situations there are multiple values that the path expression will match. By default the values are concatenated in a comma delimited string. If you would like to do something with the individual values select the Multi-Valued checkbox. Once selected a pull-down of additional options will be displayed to its right. The options displayed are specific to the type of item you are trying to provide a value to.
For a Number or Currency the options are:
- Add All—Sums the values.
- Get Maximum—Selects the largest value.
- Get Minimum—Selects the smallest value.
- Get First—Selects the first value.
- Get Last—Selects the last value.
- Number of Values—Returns a count of the matching values.
For Text the options are:
- Get First—Selects the first value.
- Get Last—Selects the last value.
- Number of Values—Returns a count of the matching values.
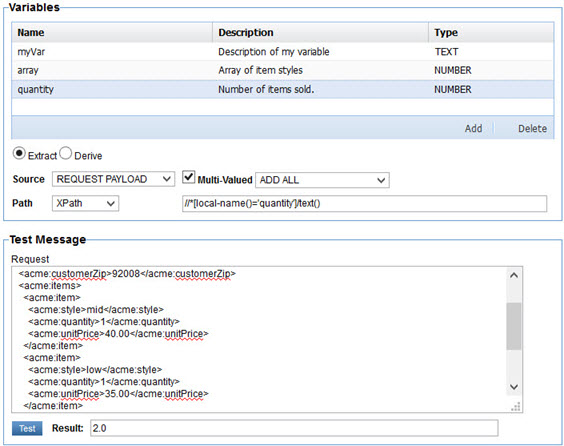
The Test button can be used to test each of these functions. In the illustration below we are assigning the sum of the quantity field for each line item of a purchase to the quantity variable.
Value Derivation
Value Derivation is the act of filling the value of a targeted item (variable, dimension, variable) from constants or expressions. The expressions can reference variables whose values are filled through data extraction so derivation can indirectly utilize extraction.
When the Derive radio button is selected, a pull-down of the following derivation options is displayed.
Constant
The value of the target item is assigned the literal value entered in the text box to the right. The literal value should match the type of the item. For example entering foo in the text box for a NUMBER variable would be an error.
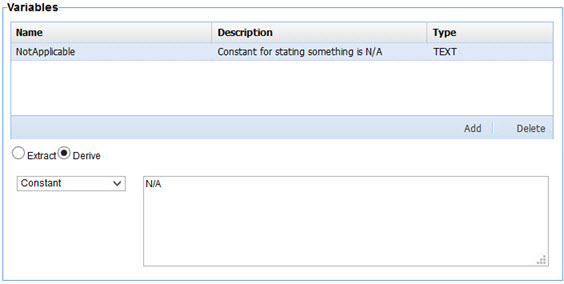
The following illustration demonstrates the creation of a variable that can be used to identify something that is not applicable with the value of N/A.
Simple Expression
The value of the target item is filled by the result of an expression written using the Unified Expression Language (UEL) as described as part of JSR-245. Other variables can be referenced in the expression simply by using their names. For example
Spring Expression
The value of the target item is filled by the result of an expression written using the Spring Expression Language (SpEL).
Operational Metric
The value of the target item is filled with a value of one of the standard operational dimensions or metrics. When this option is selected a pull-down with the acceptable values will be displayed to the right.
Addresses
An Address dimension type is actually stored as a structure with a zip code, city, state, latitude, and longitude. The job of the Business Metrics policy is to extract or derive a single field of this structure. The Akana Envision Policy Manager Service Extensions plugin will fill the rest of the fields in the structure. The policy does not require the identification of which field is being populated initially. The system will determine which field is being populated by querying the geolocation data in the database. First it checks to see if the value collected by the policy is a zip code, then a city, then state, and finally country. Once this has been determined the system will populate the latitude and longitude fields as well. These become useful when using maps in Envision.
Business Service Level Policy
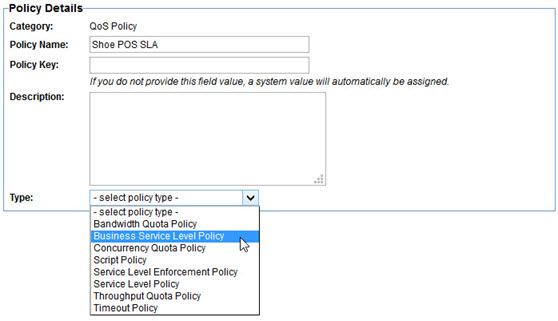
The Business Service Level policy provides the ability to define a Service Level Agreement (SLA) based on dataset defined in Envision instead of the standard operational metrics provided by Policy Manager. For example, an SLA can be created based on the number of items sold, or the number of calls made from a particular user-agent. To create a Business Service Level Policy select the Business Service Level Policy type in the first page of the Create QoS Policy wizard.
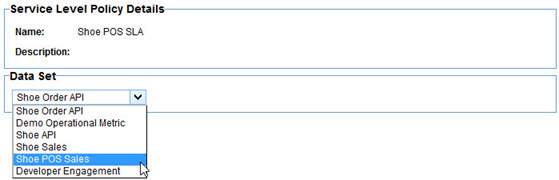
The Business Service Level Policy editor is a multi-page wizard. On the first page you select the dataset you want to use as the basis of the policy.
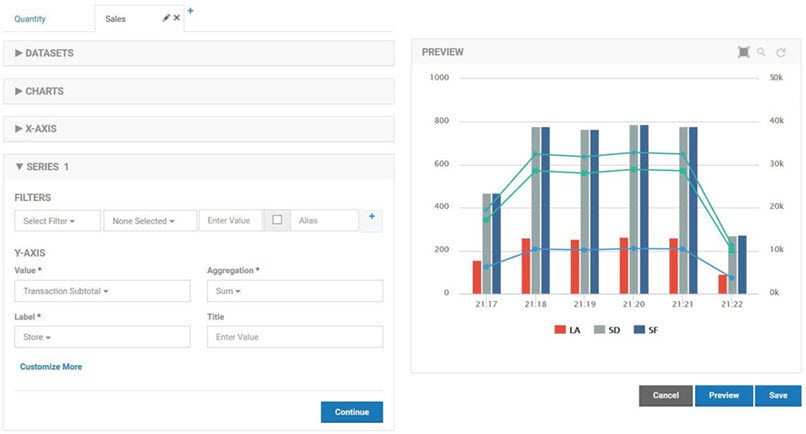
Next you select what records in the dataset you want the metrics to measure the service level with. Essentially you are defining a query, or filter.
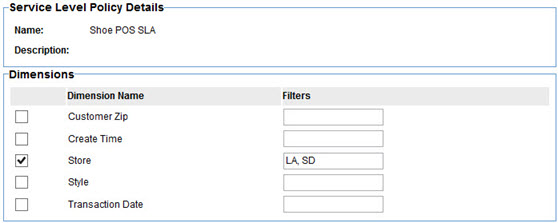
If you want the metrics to be aggregated for all records in the dataset nothing need be selected on the screen. However if you want to filter the records by one or more dimensions, select those dimensions. In the text fields to the right of the selected dimensions enter the values of the dimensions you want to filter by. In the illustration above we are filtering the dataset to only the transactions made at the LA and SD stores.
Next define the rules for the policy. This page is identical to the standard Policy Manager Service Level Policy. You select an alert code to generate when an expression is met in a specified interval.
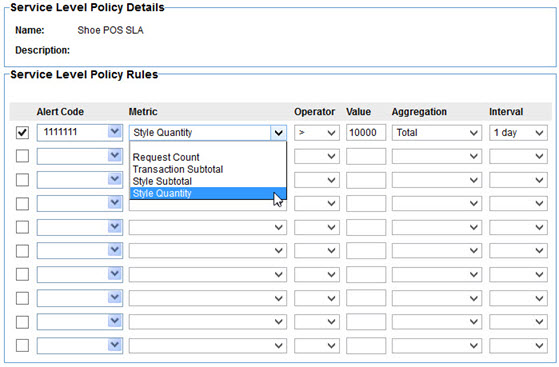
What makes this different than the standard service level policy is the metrics to choose from are those collected in the selected dataset. As seen above an alert will be generated with over 10000 shoes of a certain style are sold in a day.
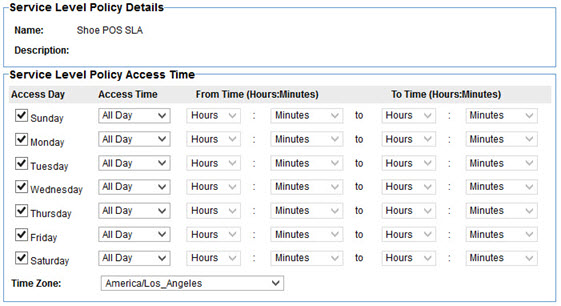
The final page is for defining the times that the policy should govern. This is also the same as the standard Policy Manager Service Level Policy.
The policy acts in a similar way to the standard service level policy. Alerts are generated when the expressions are met. As long as the expressions continue to be met on subsequent intervals nothing more is done. Once the expression is no longer met a clear alert is generated.
Operational Metrics Policy
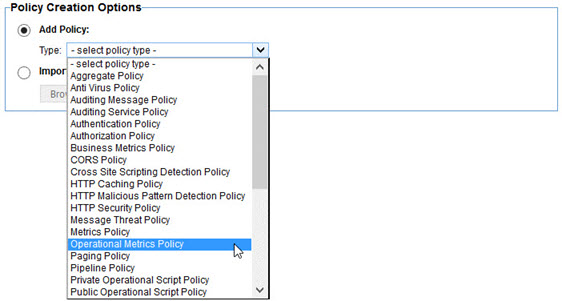
The Operational Metrics Policy is a more flexible option to the standard Policy Manager Metrics Policy. It allows you to specify what operational metrics to collect for an API in a more specific way. To create an Operational Metrics Policy select the Operational Metrics Policy type in the first page of the Create Operational Policy wizard.
The Operational Metrics Policy editor is a single page. On this page you select the metrics you want to collect and the dimensions you want to group the data by so that the data can be filtered in Envision when creating charts.
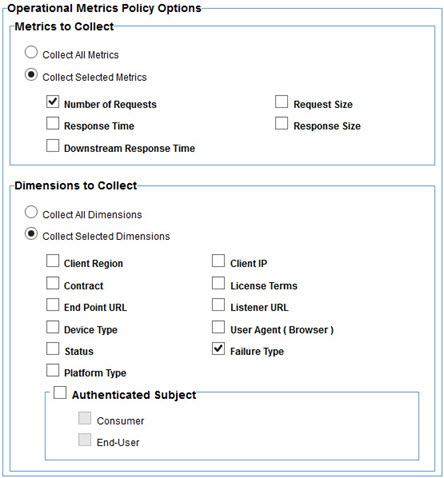
The metrics that can be collected are the same metrics collected by Policy Manager. The difference here is not all of them MUST be collected if they are not useful.
Many of the dimensions that can be used to group the aggregated metrics are also the same as those used by Policy Manager, Contract, License Terms, Failure Type (did the call result in an error or not). In addition the following dimensions can be used.
- Client Region—The location of the client making the call. It is the latitude and longitude of the client IP address.
- Downstream URL—URL of the downstream service invoked (if any).
- Device Type—Type of device making the call. This is derived from the User-Agent header.
- Status—Status code returned to the client making the call.
- Platform Type—Type of platform, or operating system, making the call. This is derived from the User-Agent header.
- Client IP—IP Address of the client making the call.
- User Agent—Value of the User-Agent header (if any).
- Authenticated Subject—The authenticated caller (if any).
Use Case—Point of Sale Metrics for Shoe Retailer
To help provide a better understanding of the API Gateway enhancements described earlier a use case will be explored in depth. The use case will center on a fictional shoe retailer ACME whose point of sale terminals communicate with a central purchasing SOAP based web service. Each transaction will be processed by the API Gateway. The retailer will use a Business Metrics policy to collect information about the transactions and feed them to Envision for aggregation and charting.
ACME has three brick and mortar stores in Los Angeles, San Francisco, and San Diego. The company sells three styles of shoes, high tops, mid tops, and low tops. ACME would like to track the sales of their shoes in a few different ways:
- Total company sales (minus sales tax)
- Total sales (minus sales tax) of each store
- Quantity sold by each store
- Quantity sold of each style
- Quantity sold of each style by each store
- Total sales (minus sales tax) by customer zip code
- Quantity sold of each style of shoe by customer zip code
In this section:
The API
As mentioned already ACME uses a SOAP web service to connect its point of sale terminals to its backend purchasing system. A sample of the SOAP payload for a transaction is as follows:
01) <soapenv:Envelope xmlns:soapenv="…">
02)   <soapenv:Header />
03)   <soapenv:Body>
04)     <sho:purchase xmlns:sho="http://acme.com/api/shoepos">
05)       <sho:store>LA</sho:store>
06)       <sho:terminal>1</sho:terminal>
07)       <sho:clerk>1001</sho:clerk>
08)       <sho:items>
09)         <sho:item>
10)           <sho:style>mid</sho:style>
11)           <sho:quantity>1</sho:quantity>
12)           <sho:unitPrice>40.00</sho:unitPrice>
13)         </sho:item>
14)         <sho:item>
15)           <sho:style>low</sho:style>
16)           <sho:quantity>2</sho:quantity>
17)           <sho:unitPrice>35.00</sho:unitPrice>
18)         </sho:item>
19)       </sho:items>
20)       <sho:subtotal>110.00</sho:subtotal>
21)       <sho:tax>8.80</sho:tax>
22)       <sho:total>118.80</sho:total>
23)       <sho:customerZip>90001</sho:customerZip>
24)       <sho:transactionTime>2002-05-30T09:30:00Z</sho:transactionTime>
25)     </sho:purchase>
26)   </soapenv:Body>
27) </soapenv:Envelope>
In the above:
- The purchase starts on line 04.
- The store where the purchase was made is on line 05. The possible values are LA, SF, and SD.
- The terminal used to make the purchase is on line 06.
- The sales clerk who performed the transaction is on line 07.
- A customer can purchase multiple shoes in a single transaction. They are listed within the items element on line 08.
- There is a single item representing 0 or more shoes of a single style being purchased in the transaction. In this example a single mid top shoe is sold on lines 09–13.
- The style is identified on line 10.
- The quantity is on line 11.
- The price for a mid top shoe at the time of the purchase was $40 as stated on line 12.
- Lines 14–18 state that the customer also purchased two low top shoes at a price of $35 each.
- The subtotal (without tax) of the total purchase is on line 20.
- The sales tax for the purchase is on line 21.
- The total transaction amount (including tax) is on line 22.
- When a purchase is made the customers ZIP code is collected and recorded on line 23.
- The time of the transaction is on line 24. Due to system latency it may not be the same time as the gateway will process or record the data about the transaction.
The Dataset
The first step in achieving the goals described in this use case is to define a Dataset for the purchases in Envision.
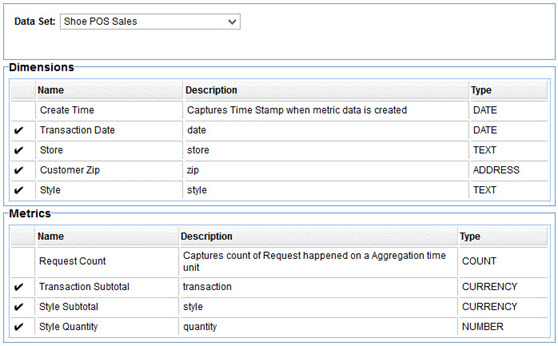
The Dataset is named Shoe POS Sales.
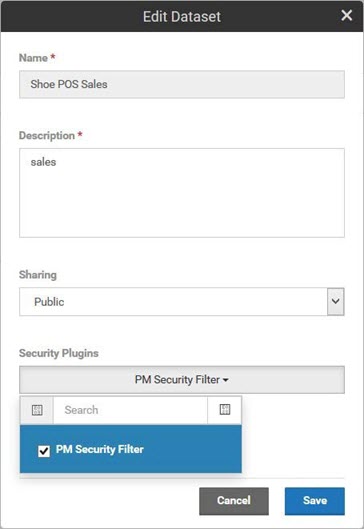
By selecting the PM Security Filter any data displayed in charts and dashboards will be secured by the Policy Manager security system. Only users with access to the APIs reporting the metrics will be able to view the information.
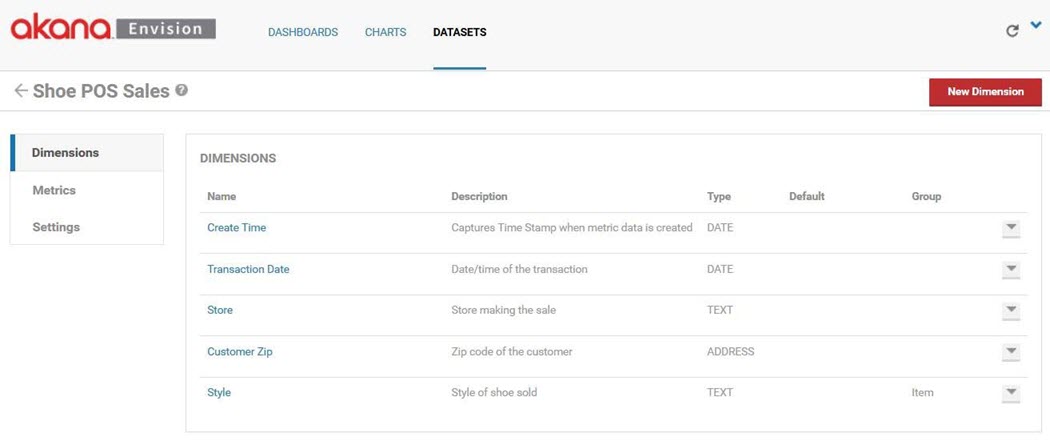
There are dimensions for each of the queries ACME wants to perform, Store, Customer Zip, and Style. The Customer Zip dimension is an ADDRESS instead of TEXT so that maps can be used to geographically view data. Note that because there may be multiple line items in a purchase there may be multiple shoe styles in a since purchase. Therefore the Style dimension is associated with a Group named Item. As we'll see in the metrics, the Item Group will include all information about a purchase line item. Finally a Transaction Date dimension is added for querying based on time (what will become our X-Axis) as this information is provided in the POS API and can be different than the time the data is collected in the gateway (Create Time).
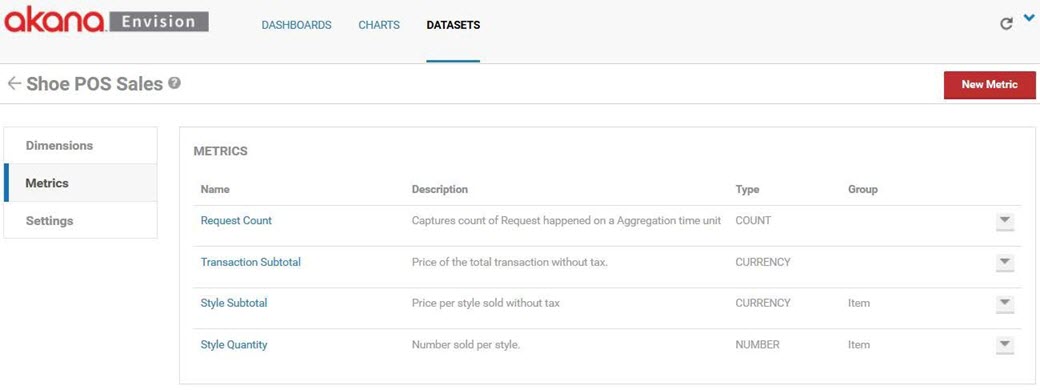
There are Metrics for each of the measurements ACME wants to take, Transaction Subtotal, Style Subtotal, and Style Quantity. ACME's measurements only require sums, so only the SUM aggregation need be performed on each metric. Since there may be multiple styles sold in a single transaction the style specific metrics are placed in the Item group along with the Style dimension.
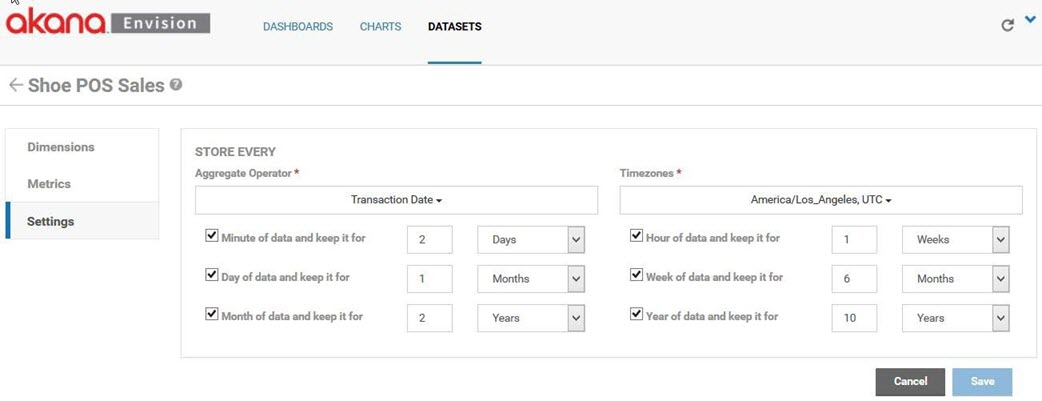
Because aggregation will be performed using the transaction date at the point of sale terminal the aggregate operator is set to the Transaction Date dimension. ACME is headquartered in Los Angeles so when determining the boundaries of daily metrics the America/Los_Angeles time zone is used.
The Policy
A Business Metrics policy is created in Policy Manager named Shoe POS Metrics Policy.
The policy fills the Shoe POS Sales dataset. There is one structure defined named Item that corresponds to the Item group in the Dataset.
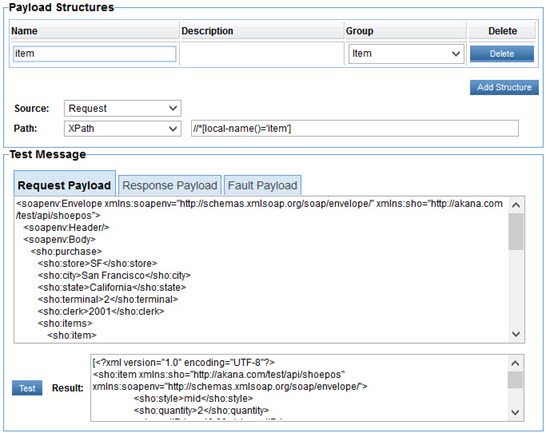
The Item structure is identified in the message using an XPath expression. When tested against the sample message described previously the XPath expression returns the shoe:item elements in the message. All subsequent XPath expressions for metrics and dimensions in the Item group will be performed relative to each of the shoe:item elements in the message.
There are no variables defined in the policy. Each of the dimensions are extracted from the message using XPath expressions.
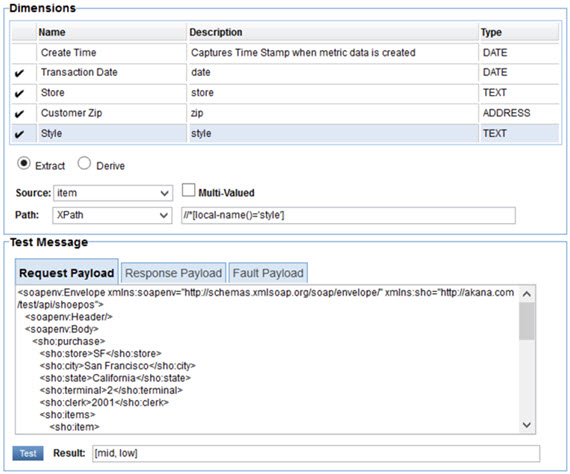
The Style dimension is in the Item group so its XPath expression is evaluated relative to each of the shoe:item elements in the message. When tested against our sample two styles are returned.
The metrics are defined in a similar way to the dimensions.
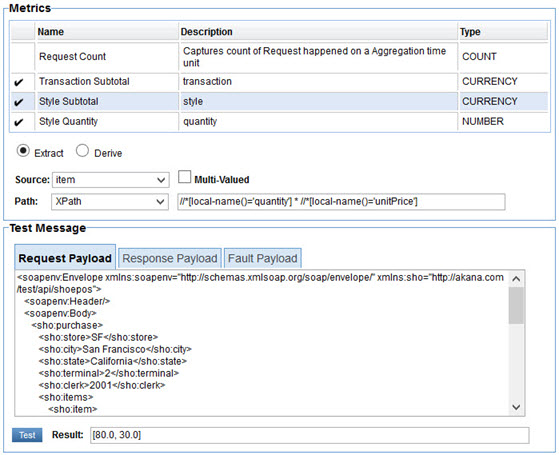
The Style Subtotal metric poses a challenge because there is not a single element in the message that provides this number. It is calculated by multiplying the sho:quantity by the sho:unitPrice. When testing the expression both subtotals are shown. During actual execution of the policy these subtotals, along with the Style Quantity metric expression results, will be grouped together in order to not lose their correlation. So instead of three separate arrays for style, quantity, and price there will be a single array of structures where each structure will have a style, quantity, and price.
With a Dataset and policy now defined, once the policy is attached to the POS API in Policy Manager the Network Director can now begin capturing and storing metrics. The data will be aggregated according to the Dataset settings.
The Charts
ACME has created charts to visualize each of the measurements stated in the use case introduction. In a real-world scenario, their charts might be tracking data by the month, but in these examples the charts will track by hours so that users trying to use the examples as learning tools can see faster results. A filter is applied to all charts that will only display the data for the last day.
The first chart is a combination chart that displays company wide sales and the sales for each store.
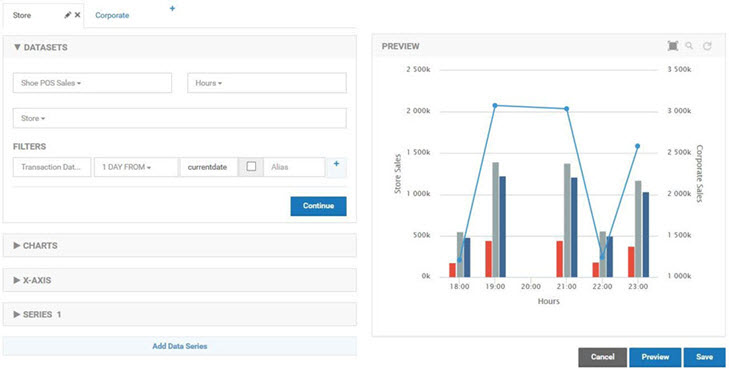
The first chart in the combination is a standard column chart with a column per store representing the total sales for a given hour. The second chart is a standard line chart with a single line reflecting the sum of all transactions made using the POS API. There is no Drilldown capability defined so both charts will be displayed at the same time. The column chart is defined first so that the line of the line chart will be layered on top.
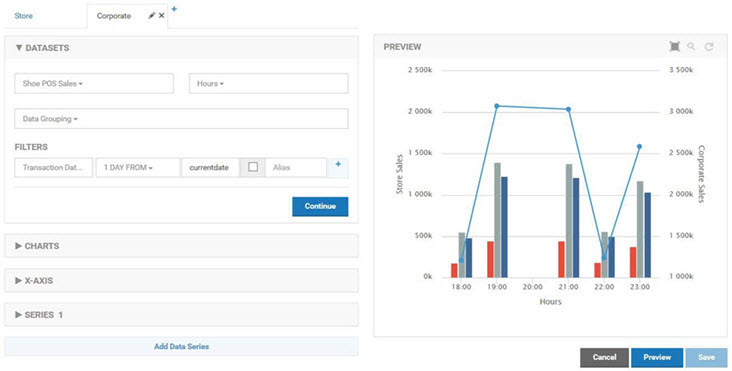
Both charts in the combination use the Shoe POS Sales dataset as their source with the Hours Duration. The store chart uses the Store Dimension for Data Grouping. The company chart has no grouping as the measurements should be summed without breaking them down in any way.
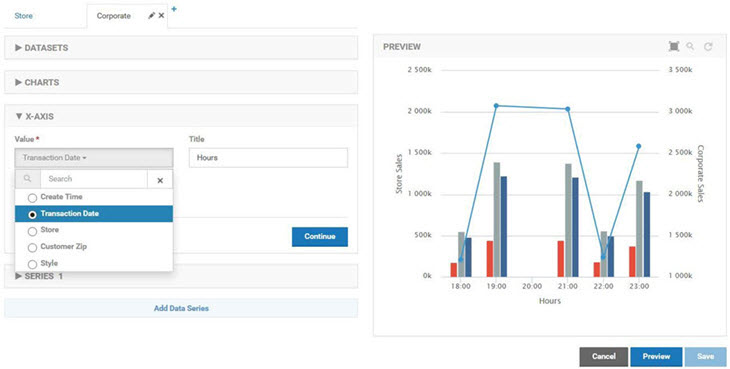
The measurements will be displayed over time. The X-Axis Value Ref will therefore use a date field. The Transaction Date is used as opposed to the Create Time to be more reflective of the time at the terminals.
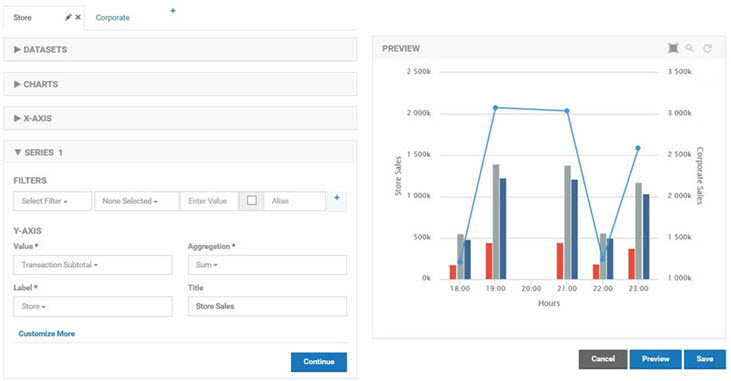
The data series for store sales uses the Transaction Subtotal metric for the Y-Axis Metric. The Aggregation Operator is Sum. The Label Ref is the Store dimension so there will be a separate column for each store's subtotal.
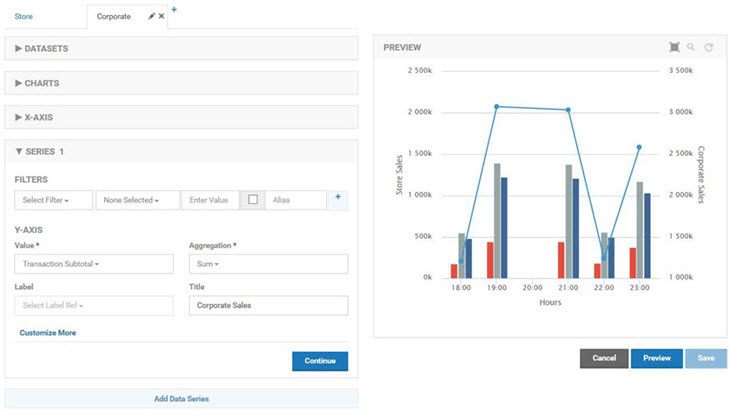
The data series for corporate sales also uses the Transaction Subtotal metric for the Y-Axis Metric. The Aggregation Operator is Sum as well. Since there is no Data Grouping there is no selection for Label Ref and there is only one line drawn for the subtotal.
The second chart is a combination chart that displays the quantity sold by store, by style, and by style for a given store. The first chart in the combination is a standard column chart with a column per store representing the total sales for a given hour.

The second chart is a standard line chart with a single line reflecting the sum of all transactions made using the POS API. There is no Drilldown capability defined so both charts will be displayed at the same time. The column chart is defined first so that the line of the line chart will be layered on top.
Both charts in the combination use the Shoe POS Sales dataset as their source with the Hours Duration. The store chart uses the Store Dimension for Data Grouping. The company chart has no grouping as the measurements should be summed without breaking them down in any way.
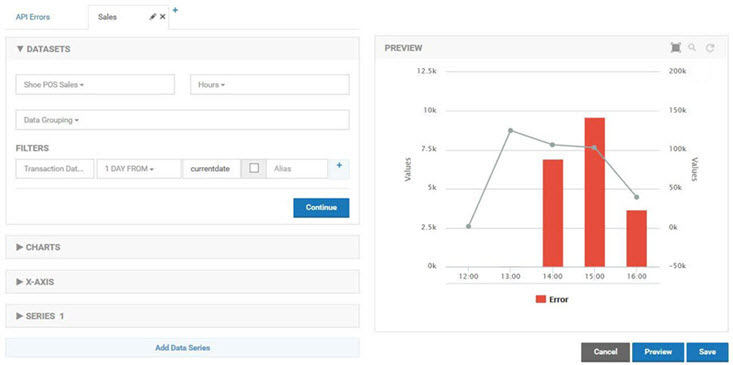
The third chart is a combination chart that displays the quantity sold company wide and overlays the number of errors that have been reported by the API. It provides a quantitative impact of errors on the business. The first chart in the combination is a standard column chart with a column for the number of errors the API encountered. It uses the API Operational Metric Dataset to graph errors.
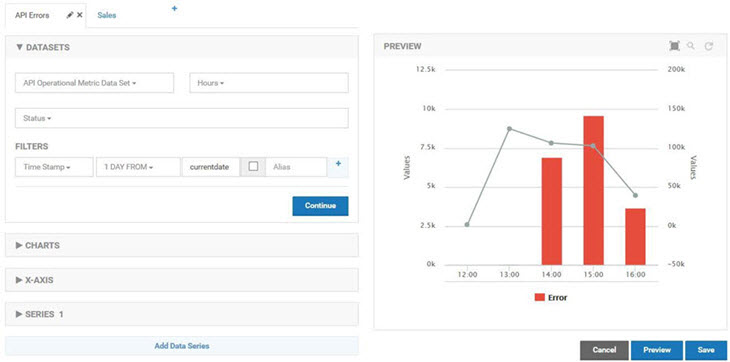
The second chart in the combination is a standard line chart with a line for the total quantity sold over time. It uses the Shoe POS Sales dataset for the quantity. The X-Axis of the charts use different dimensions, Time Stamp vs Transaction Date, but as long as they have values that align the graphs overlay perfectly.
The Dashboard
ACME has created a single Dashboard that will display all the POS charts on a single page.