Monitoring Tabs: Alerts and Logs
Overview of monitoring capabilities in Policy Manager.
For more information about alerts and logs:
- Policy Manager Alerts and associated topics
- Using the Basic Auditing Policy (policy doc)
On this page:
Overview
Monitoring information, including alerts and logs, is available in Policy Manager at the following levels:
At each level, a monitoring tab gives you access to alerts, logs, and other information so that you can view the state of functions in real time.
Organization Monitoring Tab
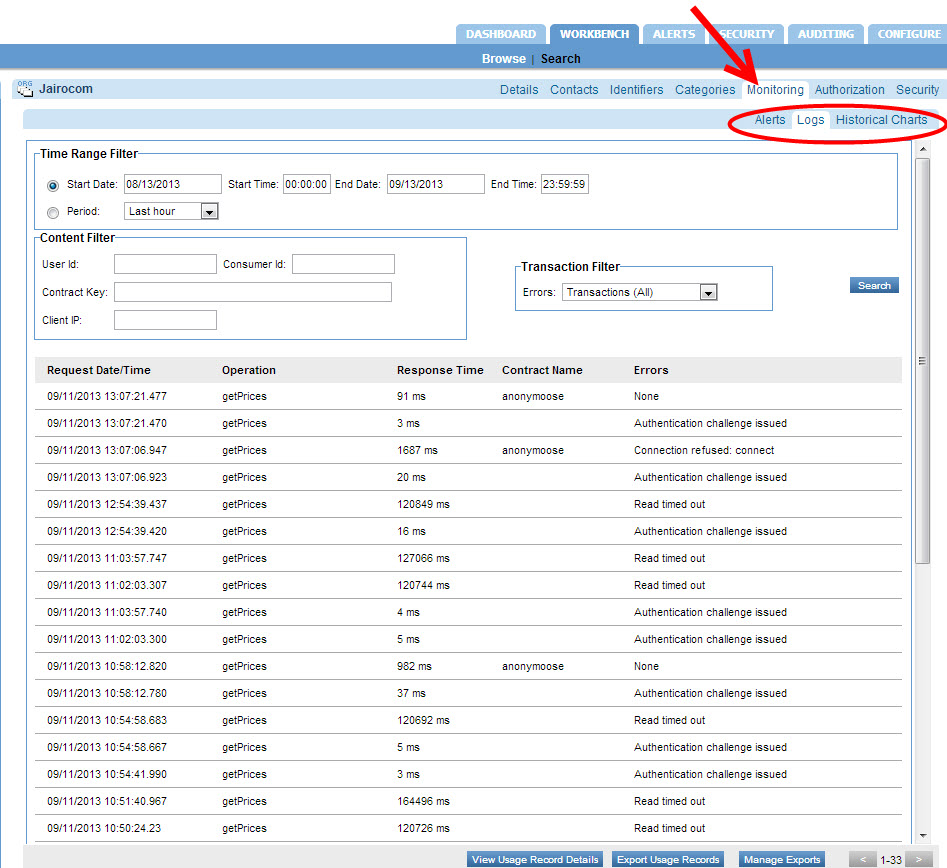
The highest level of monitoring information is available via the monitoring tab for an organization. This lets you view all logs and alerts sent by services and sub-organizations within the organization you are viewing.
This tab includes three types of alerts:
- Service Alerts
- SLA Alerts
- Container Alerts
If there is an error with one of your services, the monitoring tab is a good place to look first, to see if the alerts and log entries can help you identify the problem.
An example of the monitoring tab for an organization is shown below.
Service-Level Monitoring Tab
Each service also has its own monitoring tab, with alerts and logs relating only to that service and its operations, as shown below.
If the basic auditing policy is being used, the Monitoring > Logs tab also shows usage data for the service. However, as a best practice this should only be used while troubleshooting or in non-production environments as the payload data is stored in the database.
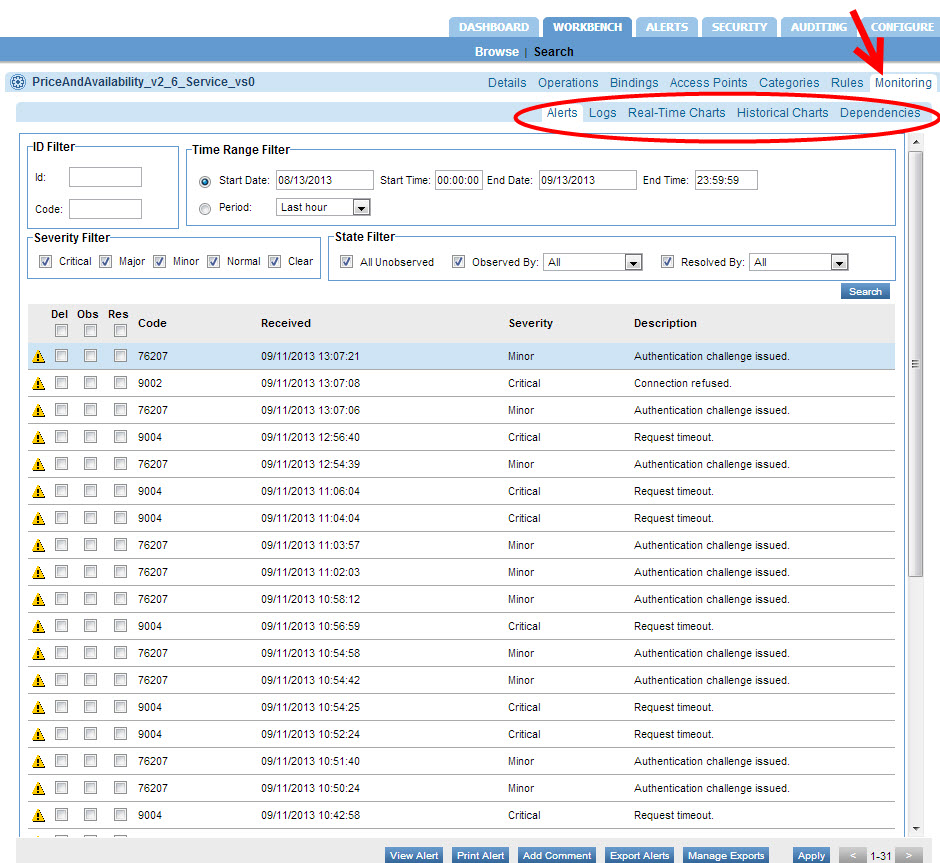
Note: The Dependencies tab visible in the above image was removed in version 2020.2.0.
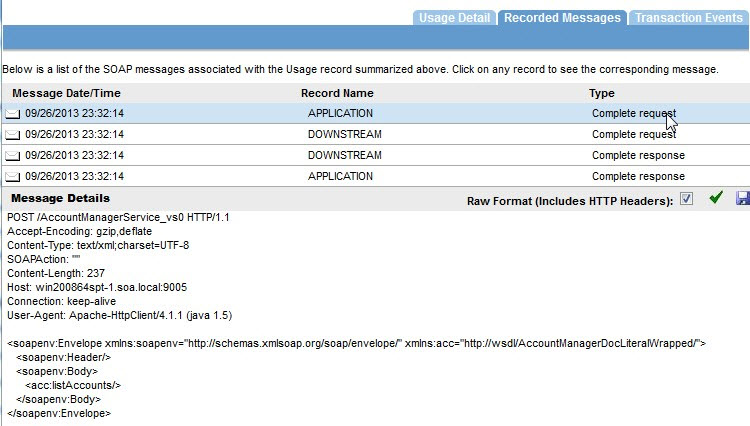
If the detailed auditing policy is being used, you can also view the request and response payload in the Logs tab. Double-click a specific message to see the Usage Data Details overlay. This includes usage detail, recorded messages, and transaction events. In the Recorded Messages tab you can see the individual request and response message. You can also choose to view Raw Format, which includes the HTTP headers. An example is shown below.
Monitoring Tab for the Container
If there is an issue with a specific container, alerts are displayed in the container's monitoring tab as well. You also see the container alerts when you log in to the Policy Manager console.
The example below shows the monitoring tab for a container.
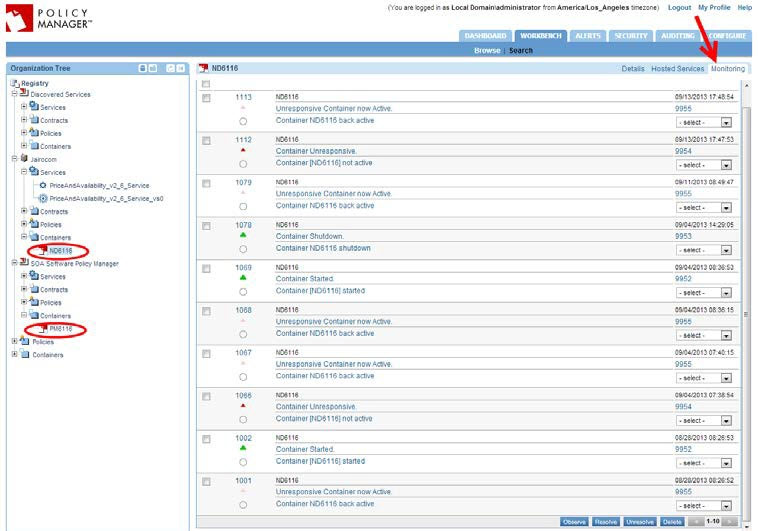
In some cases the information on the monitoring tab can help you discover a deeper error occurring within the container or service.
The next step in troubleshooting an instance is to make use of the logging system.
Monitoring Tab for the Contract
A monitoring tab is also available for each contract, giving access to the logs applicable to the contract.