Admin Console 2022.1.0—Overview
Learn about the installation, configuration, monitoring, and diagnostic actions available in the Admin Console redesigned user interface, available as an option in 2022.1.0.
Valid in Version: 2022.1.0 and later
Table of Contents
- Introduction
- Logging In
- Menus
- Dashboard
- Features
- Tasks
- Configuration
- Diagnostics
- Using Search in the Admin Console
- Setting the redesigned UI to be the default
- Logging Out
Introduction
The Admin Console user interface allows you to install and configure features into the container. If you have multiple containers in your implementation, each container has its own Admin Console, used to manage the features installed and configured in that container, to monitor the container, to view diagnostics, and to troubleshoot if needed.
In the Admin Console for a container you can:
- Install and uninstall features.
- Run configuration tasks.
- Configure properties for the container and for the features installed in the container.
- View diagnostics.
- Generate a report of container details.
This user interface was significantly redesigned for version 2022.1.0. Some of the key improvements in the redesigned user interface are:
- Improved Search feature to help find features and properties quickly within a page.
- Back-end values for feature names are easily available on the Available Features or Installed Features list.
Notes:
- In 2022.1.0, the new version is installed automatically, but is not the default.
- You can update the configuration settings to make the new version the default, or to switch between the old and new versions. See Setting the redesigned UI to be the default below.
- All the functionality of previous versions is in the new version.
Logging In
Part of installation includes providing the Administrator credentials for logging in to the Admin Console for the container.
In version 2022.1.0, the redesigned Admin Console is not the default. To access the redesigned UI, you'll need to log in, then change the URL.
The login URL follows this pattern: {protocol}//{hostname}:{optional_port}/admin/console.html.
For example: https://portal.acmepaymentscorp.com:7900/admin/console.html.
Log in, and then change the last part of the URL, as follows:
- From: /admin/console.html
- To: /admin/ui/index.html
You can also change the settings so that the redesigned Admin Console is the default. For instructions, see Setting the redesigned UI to be the default below.
If you change the default setting, the login page looks something like the below:
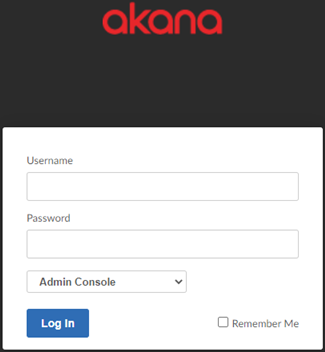
Enter the credentials, make sure Admin Console is selected, and click Log In.
Menus
When you log in to the redesigned Admin Console, you'll see the Dashboard. For details about this page, see Dashboard below. From here, you have access to the following additional pages:
- Features: Shows features that have been installed, and allows you to install new features or update existing features. For more information about this page, see Features below.
- Tasks: Configuration tasks that you might need to perform as part of initial installation, maintenance, or troubleshooting. For a full list of configuration tasks, see Using Configuration Actions. The tasks available in a specific instance of the Admin Console are determined by the features that have been installed. For more information about this page, see Tasks below.
- Configuration: Shows the list of configuration categories. Each category has one or more properties. The specific list of configuration categories might vary according to the features installed in the container. For more information, see Configuration below.
- Diagnostics: Information about system resources and the processes that are running. For more information, see Diagnostics below.
Dashboard
The Dashboard is a visual representation of how the container is running.
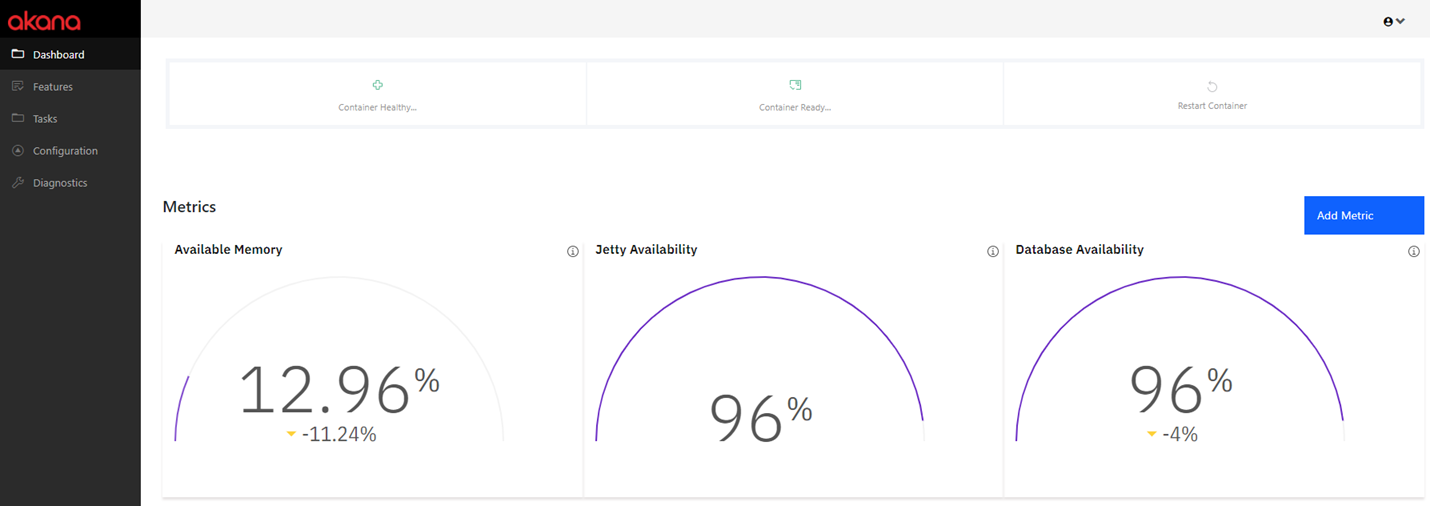
From here, you can drill down to review details as needed. You can:
- Review container status and actions:
- Container healthy/not healthy
- Container ready/not ready
- Restart container
- Metrics: In the Metrics section you can:
- Review the default metrics of Available Memory, Jetty Availability, and Database Availability.
- Add a new metric or set of metrics that you want to monitor: see Dashboard: Adding a Metric below.
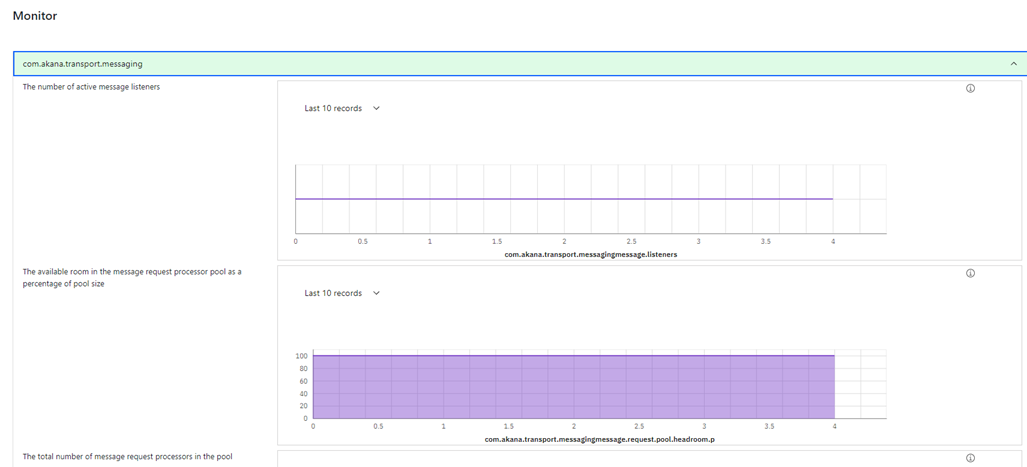
- Monitor: View a visual representation of various metrics. Metrics are listed, with an expand/collapse icon for each process. An example is shown below.
Dashboard: Adding a metric
The Dashboard comes with a set of default metrics. You can add new metrics as needed.
To add a metric
- On the Dashboard page, click Add Metric. The Add Metric Group page appears, as shown below.
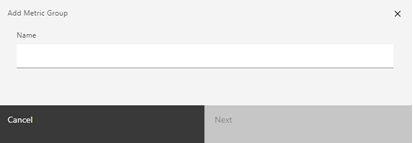
- Enter a name for the new metric or metric group. The name you choose will be displayed on the Dashboard. Click Next. The Select Metrics page appears, as shown below.
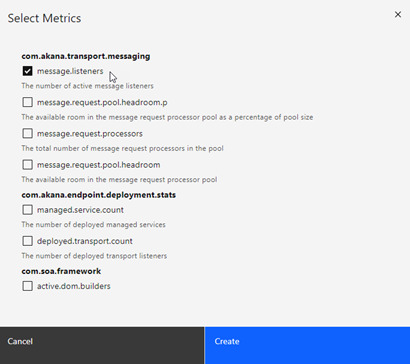
- Choose one or more metrics that you want to include in the new metric group. Scroll down as needed to see additional metrics that are available. When done, click Create.
The new metric group is displayed on the Dashboard, in the Metrics section below the existing metric group. You can:
- Add metrics to the group: click the + icon to the right of the group, and choose additional metrics.
- Remove the metrics group from the Dashboard: click the X icon to the right of the group, and then confirm.
Features
A key capability of the platform is to manage the various components that you can install. Different capabilities are separated into separate line items, which are OSGi components. This enables you to install only the features that you need.
Like most of the features in the Admin Console, the user interface is often used initially to learn and set up a system, but later on, deployment transitions to an automated model that can be replicated more easily.
The Features page has three tab:
- Installed Features—Features already installed on the container.
- Available Features—Features that have not yet been installed.
- Repository—A list of repositories that store product features available for installation on the current container instance.
Note: For a summary of all the options available on the Features list, see Admin Console Features List (2022.1.0).
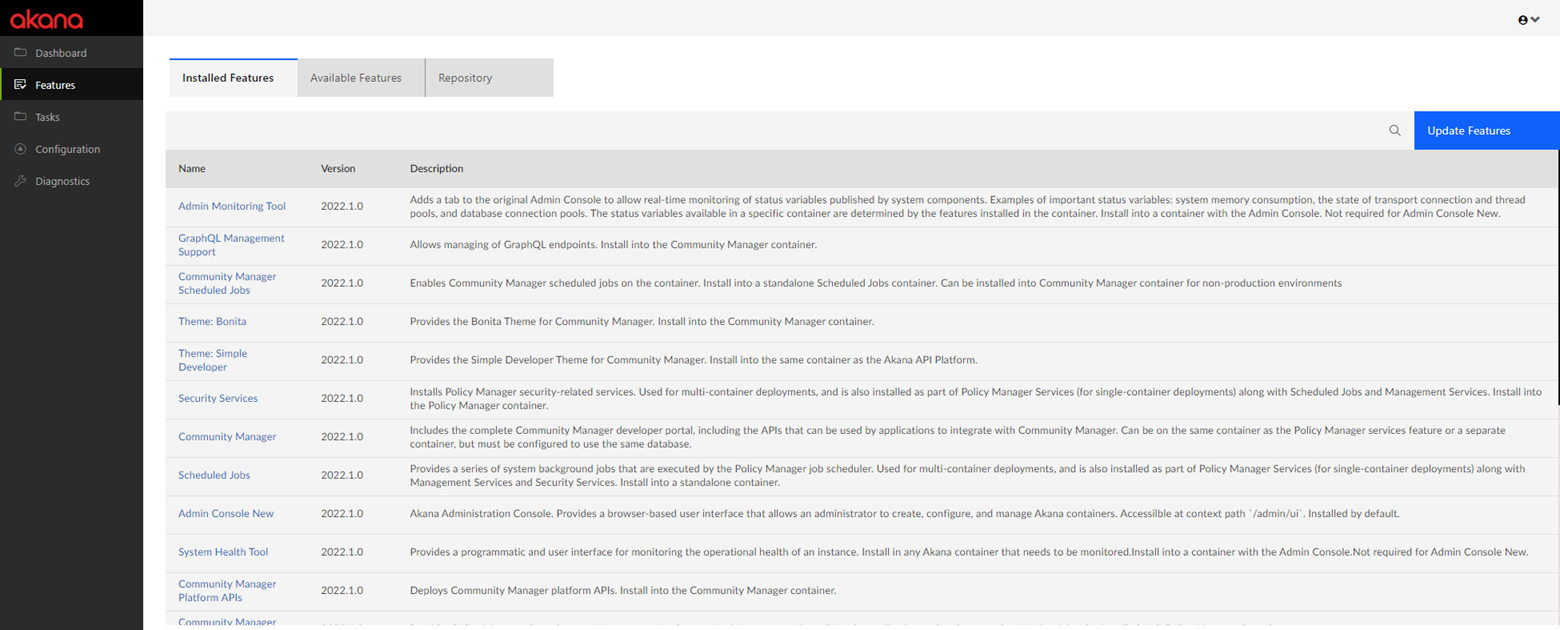
Installed Features tab
The Installed Features tab shows features that have been installed, with version and description. You can use Search to find the features you want.
If needed, you can check if there are feature updates.
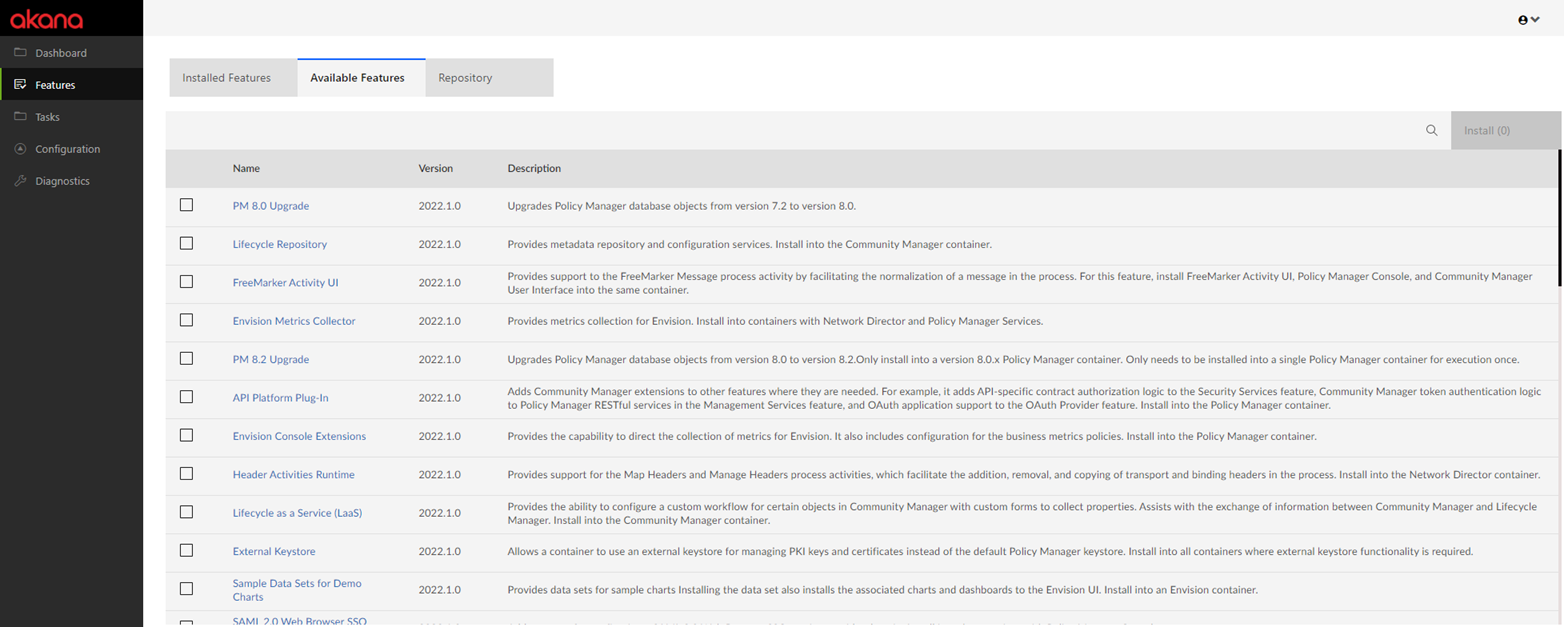
Available Features tab
The Available Features tab shows features that are available for installation on the container, but not yet installed. An example of this page is shown below.
You can use Search to find the features you want. To install one or more features, click the box to the left and then click Install.
By default, the list of available features is shown. In case there is something you want to install and it doesn't appear on the list:
- Check the Installed Features list in case the feature was already installed.
- Check with your Akana representative in case the item requires download of a separate ZIP file.
Note: In the previous version of the Admin Console, separate lists of features, plug-ins, and tools were available via a drop-down list. Now, all options are included on the Available Features and Installed Features tabs.
Repository tab
The Repository tab displays a list of repositories that store product features installed on the current container instance.
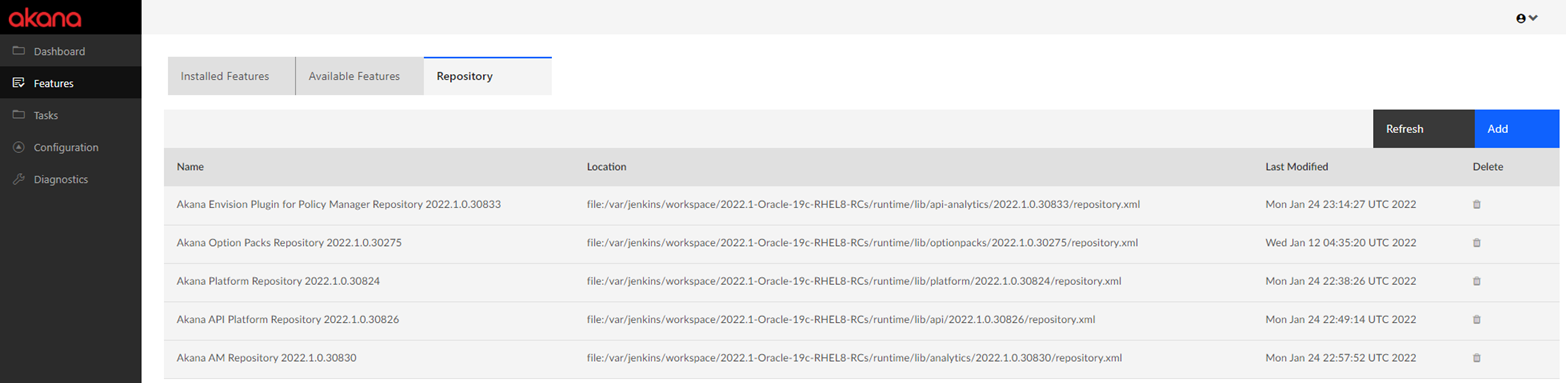
For each repository, the list includes: Name, Location, Last Modified date, and a Delete option.
On the Repository tab you can:
- Review current repositories.
- Install container updates: click the Refresh button to check for updates and install any available. Updates can include bundles that represent new features or updates to existing features.
- Add a repository URL: Product updates are installed via the Admin Console. The first step in applying a product update is to add the Repository URL that includes the update data, via the Repository tab. Click the Add button. In the Add Repository overlay, provide location and credentials.
- Delete a repository that you added: highlight the repository and then click the Delete icon to the right.
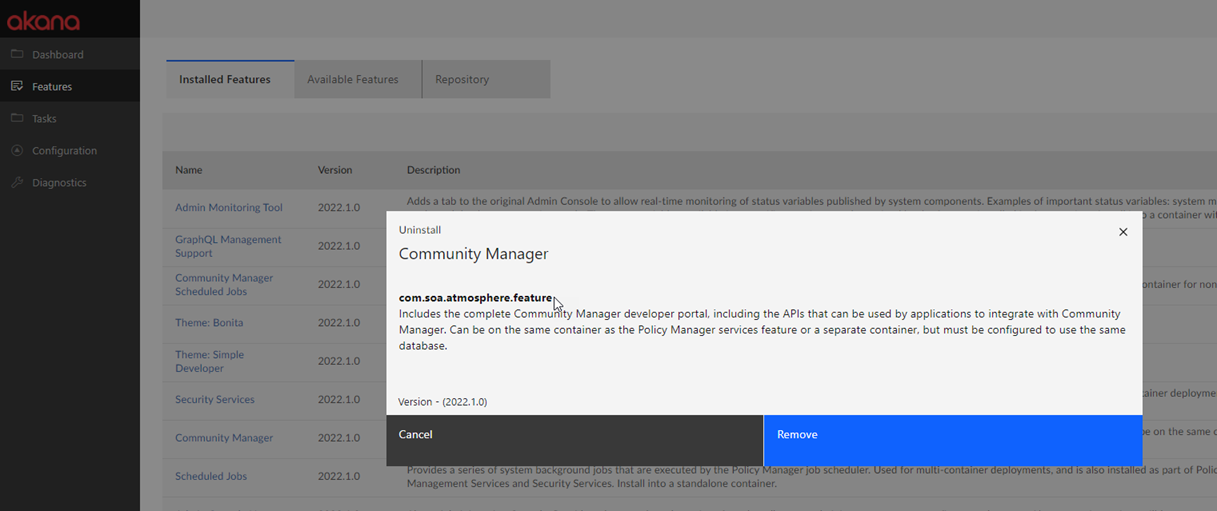
Viewing the back-end values for features and tasks
If you're using automation recipes, you'll need to know the back-end value for each feature, because those are the values that are referenced in the recipes.
In the redesigned Admin Console, you can easily view details about a specific feature, including the back-end value. Just find the feature on the Available Features or Installed Features list, and click the link in the feature name.
In the example below, the user first uses the Search feature to help locate the Community Manager feature, and then clicks the feature name to review the details. The back-end feature name is com.soa.atmosphere.feature.
For more information on using automation recipes, see Automation Reference Guide.
Tasks
The Tasks list is the summary of installation, creation, configuration, and maintenance tasks that you can perform on the container. There are two tabs:
- All: A summary of all configuration tasks.
- Pending: During the installation process, after features are partially installed, some tasks are pending. Installation is fully complete when all features are installed and all pending tasks are complete. In general, during normal operation of the container, there should be no pending tasks.
An example is shown below.
Note: For a summary of all the options available on the Tasks list, see Admin Console Tasks List (2022.1.0).
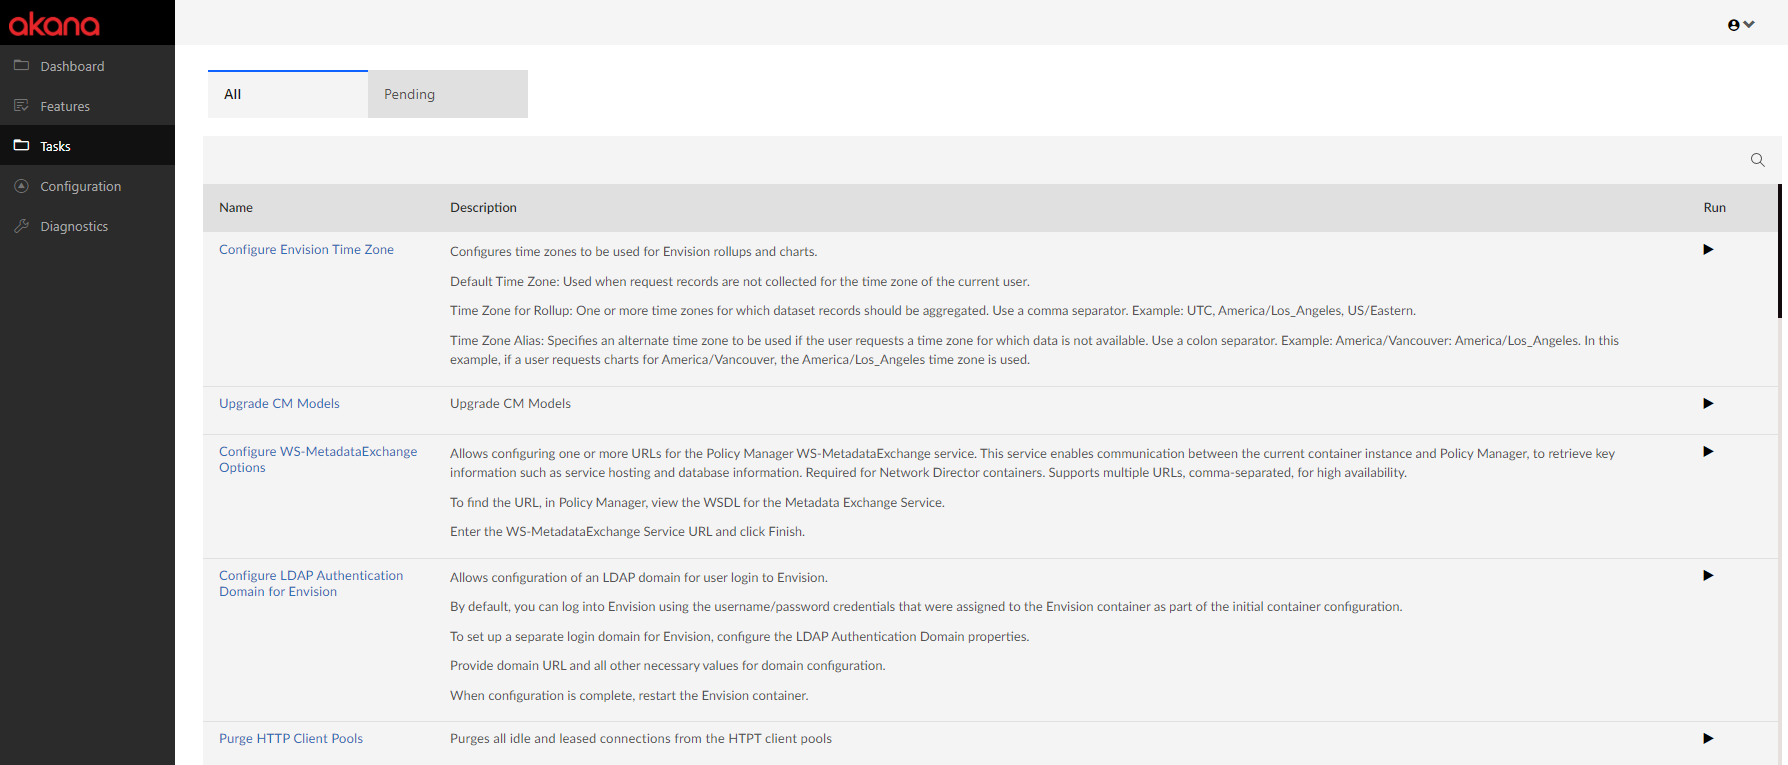
Find the task that you want to run, and then click the arrow to the right. Follow the prompts to run the task. In some cases, additional information is needed. For details about configuration tasks, see Using Configuration Actions. The illustrations are for the earlier version of the user interface, but the information collected is the same.
Configuration
The Admin Console includes many settings that you can modify, either as part of initial container configuration or as part of performance tuning. Settings are grouped into configuration categories, each of which has one or more properties. Some properties have default values, and some do not.
Some of the advantages of using configuration settings:
- Basic configuration
- Optimizing for performance
- Tightening security settings for platform hardening (see Akana Platform Hardening Guide)
- Deployment troubleshooting
- Bootstrapping a container as a team prepares for automation
A sample configuration settings page is shown below.
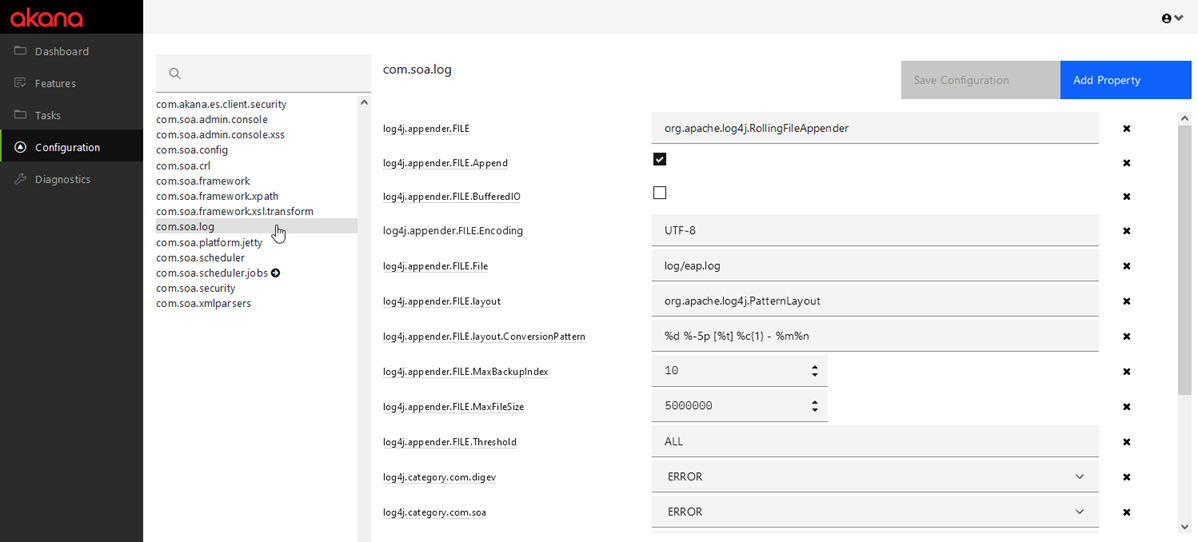
Some configuration categories appear only when certain features are installed.
Click the specific configuration category, or use the Search property to search for the property across all configuration categories. Type the new value and click Save Configuration.
In some cases you can add a property that does not appear in the configuration category: click Add Property. You must know the name of the property and available values. If you need to add a property, the documentation or your Professional Services or Support partner will advise you.
Diagnostics
The Admin Console provides diagnostic information via the following tabs:
If there is a problem with the container, this information can be very useful in troubleshooting.
All the above options correlate to the options available via the System tab in the earlier user interface: see System tab.
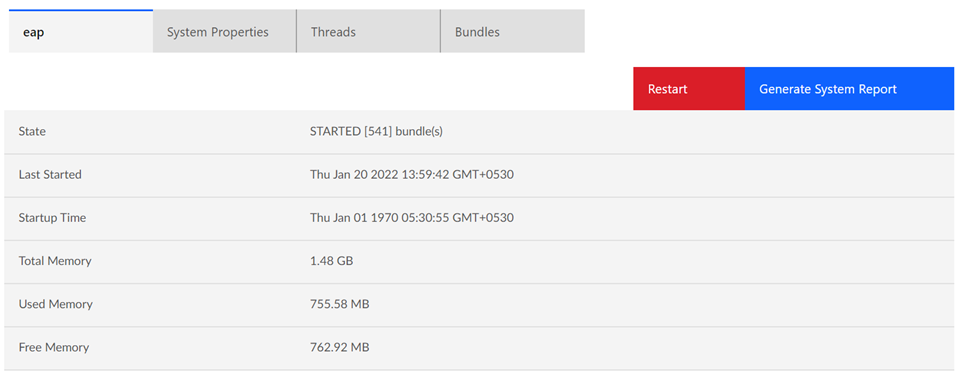
Container {container name} tab
The first Diagnostics tab takes the container name, and shows details about the container such as last start date, total memory, and free memory. In the example below, the container name is eap. Click Generate System Report to generate an HTML report of all the diagnostic information for the current container, from all four tabs.
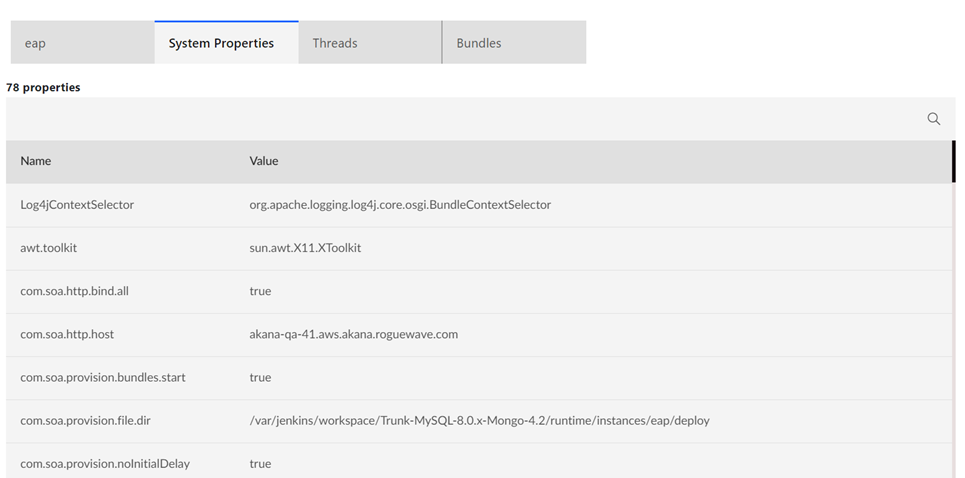
System Properties tab
The System Properties tab provides a summary of system properties and values. An example is shown below.
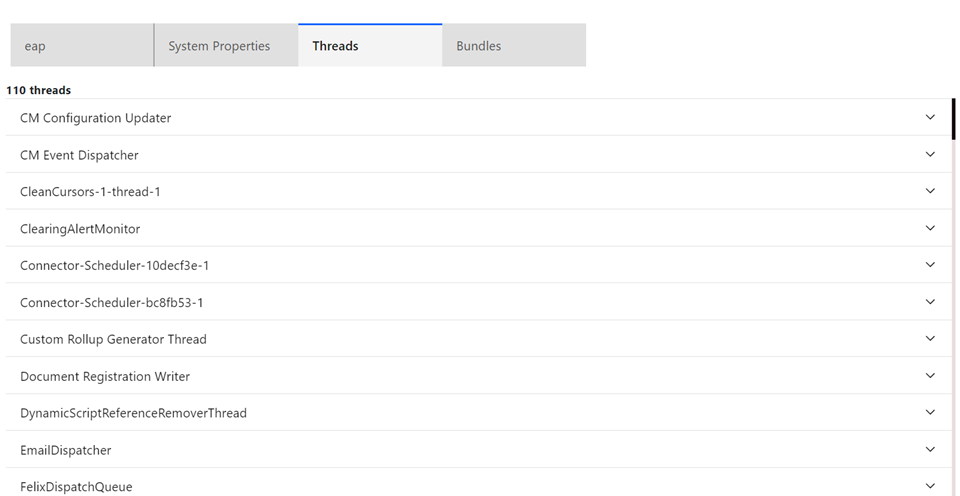
Threads tab
The Threads tab lists all running threads. An example is shown below. For any specific thread, click the icon to the right to view details.
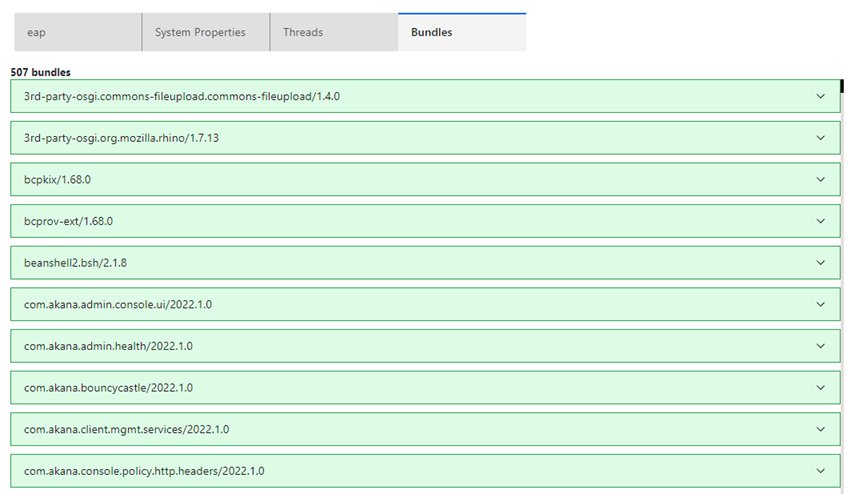
Bundles tab
The Bundles tab lists all bundles in the container. An example is shown below. For any specific bundle, click the icon to the right to view details.
Using Search in the Admin Console
The redesigned Admin Console includes enhanced search capability in some pages. For example, you can search for a string across all the information in the following pages:
- Features > Installed Features
- Features > Available Features
- Configuration
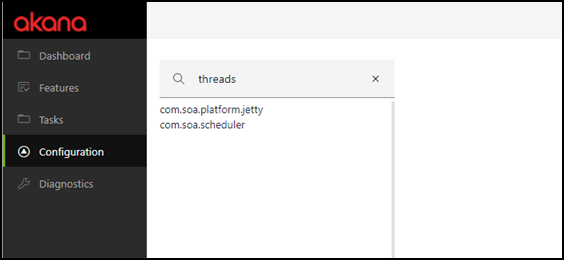
The example below shows searching for a configuration property in any of the categories, using the search box at the top of the category list. The search string is threads. Properties with this string in the name occur in two of the configuration categories. The search feature helps in quickly locating properties.
Setting the redesigned UI to be the default
In 2022.1.0, the existing Admin Console user interface is the default. However, you can change a configuration setting to make the redesigned user interface the default. Note that you will need to access the new UI at a slightly different URL, as explained in Logging In above.
To change the setting controlling the default Admin Console user interface
- Log in to the Admin Console (https://localhost:{port}/admin/console.html).
- Go to Configuration > Configuration Categories and choose the com.soa.admin.console category as shown below.
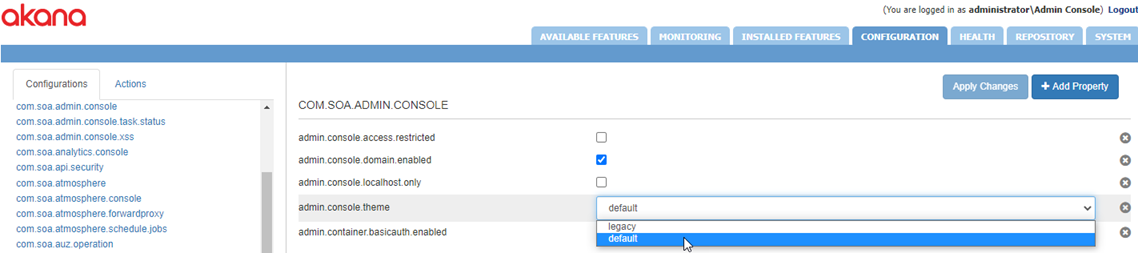
- Change the admin.console.themed property from legacy to default.
- Save changes.
- Change the URL from /admin/console.html to /admin/ui/index.html and then log in again.
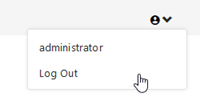
Logging Out
When done, use the drop-down at the top right to log out of the Admin Console: