Monitoring in Policy Manager
A description of the monitoring features available in the Policy Manager Management Console.
Table of Contents
Overview
The Policy Manager Management Console provides multiple ways that you can monitor your traffic, including viewing traffic volume and detail in different chart formats and monitoring alerts and logs.
Monitoring options vary according to the resource. For example, an organization and a service have different monitoring options.
Monitoring is available at these levels:
- For the entire organization
- For each container
- For each service
- For each contract
For more information on monitoring at different levels, with examples, see Monitoring Tabs: Alerts and Logs.
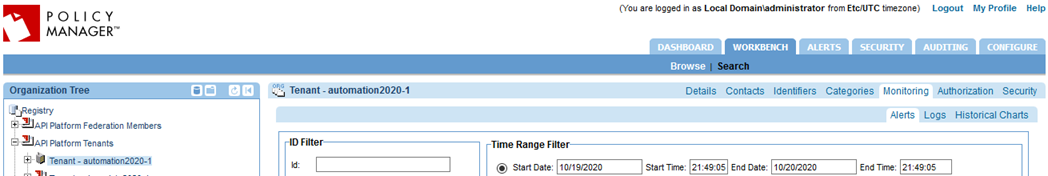
Navigation, Organization: On the left, choose your organization. On the right: Workbench > Monitoring, as shown below.
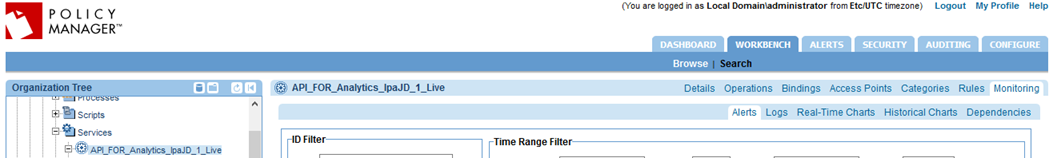
Navigation, Service: On the left, choose the service. On the right: Workbench > Monitoring, as shown below.
The following options are available:
Alerts
The platform provides an event monitoring system that is used to monitor web services and associated system activity that occurs during the operation of your Policy Manager deployment.
Navigation: On the left, choose your organization. On the right: Workbench > Monitoring > Alerts.
Notes:
- You can configure which alert types you would like to monitor and define the notification parameters that will be invoked when a transaction, operation, or event fails.
- The specific types of events or failures that raise alerts are predefined as Alert Codes.
- Alert functionality includes configuration and management tools for viewing, analyzing, and filtering alert data.
- The Alerts tab on the main navigation is the starting point for beginning alert administration activities.
Additional resources for information about alerts:
- Policy Manager Alerts and associated topics
- Monitoring Tabs: Alerts and Logs
Logs
The platform logs certain events and displays them in the Logs tab so that you can monitor logged events and address as needed.
Navigation: On the left, choose your organization. On the right: Workbench > Monitoring > Logs.
From here, you can:
- View alerts
- Define time range, search criteria, and filters to define a dataset.
- View usage record details
- Export usage records in XML format
Additional resources for information about logs:
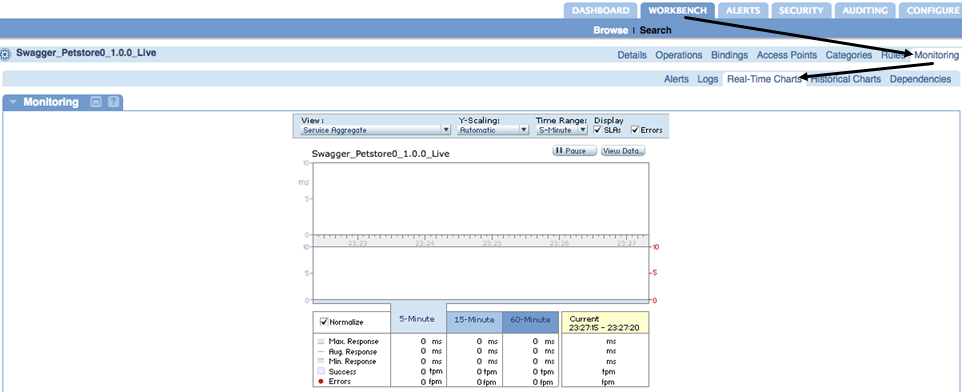
Real-Time Charts
You can view analytics data in the form of real-time charts.
Navigation: On the left, choose your organization. On the right: Workbench > Monitoring > Real-Time Charts.
Additional resources for information about real-time charts:
- Monitoring Issues (troubleshooting information)
Historical Charts
You can view analytics data in the form of historical charts for a customized time period. You can also export the historical data.
Navigation: On the left, choose your organization. On the right: Workbench > Monitoring > Historical Charts.
Additional resources for information about historical charts:
- Monitoring Issues (troubleshooting information)
Dependencies
In the monitoring tab, you can view dependencies. If a service calls another service within the same activity or transaction, an alert is generated with the details of the discovered dependency.
Navigation: On the left, choose your organization. On the right: Workbench > Monitoring > Dependencies.