Creating a Dataset
Learn how to create an Envision dataset and configure dimensions and metrics.
Supported Envision Versions: 1.0, 1.1, 1.2
On this page:
Introduction
In the previous topics we described the concept of a dataset. In this chapter we will describe how a dataset is created in the Envision product.
Datasets
When you log into Envision you are presented with a top level menu consisting of DASHBOARDS, CHARTS, and DATASETS. Select the DATASETS menu item.

You are then presented three lists of datasets, My, Favorites, and Shared.
- My—Datasets that the logged in user has created.
- Shared—Datasets that others have created and made available to the user.
- Favorites—Datasets are those selected by the user to (either their own or someone else's) to be in the list. It provides a faster lookup of commonly used items by giving them their own list.
Create New Dataset
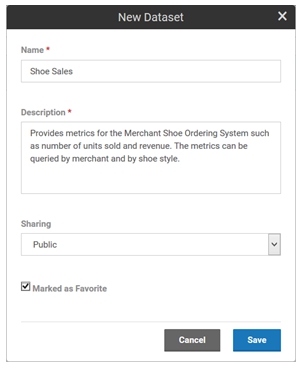
Select New Dataset to start the process of creating a new dataset. A pop-up will be displayed where you can enter a name, a description, and designate how it will be shared.

Dataset Options
A dataset can be shared with other users. When a dataset is shared users who are not the author can view the dataset and build charts against it. They cannot change the dataset. The dataset will automatically be placed in the My datasets list. If the Marked as Favorite checkbox is checked it will also be placed in the Favorites datasets list.
Each dataset card in a list has a pull-down menu of options that can be performed on the dataset.

- Edit—Displays the pop-up used to create the dataset initially so that changes can be made.
- Copy—Creates a copy of the dataset. The same pop-up will be displayed once again but this time it will before a new dataset and all the information from the copied dataset is filled in.
- Favorite /Unfavorite—Can be used to toggle whether the dataset should be placed in the Favorites list.
- Delete—Removes the dataset from the system. If any charts exist that use the dataset an error will be displayed to avoid breaking any dependent charts.
To define the details of a dataset such as metrics and dimensions, select the name of the dataset on the dataset card. The dataset details page displays. The page is divided into three sections, Dimensions, Metrics, and Settings.
Dimensions
The Dimensions section lists all the dimensions for the dataset. Dimensions are the properties of a dataset you use to query or organize metrics by. They provide the basis for how many combinations of aggregations will be made.

Add New Dimension
- Each dataset is created initially with a single default dimension, timestamp.
- The timestamp dimension will group all metrics collected with a timestamp within the same collection time interval.
- The dimension can be deleted if you are not interested in time-based aggregations, but there must be at least one Date dimension for aggregation over time to function properly.
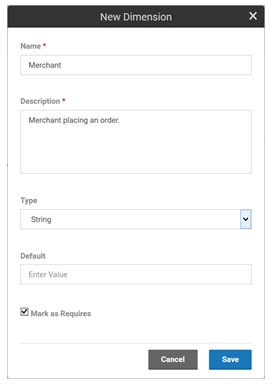
To add another dimension, select New Dimension. A pop-up displays where you can enter a name, a description, a type, and a default value (if any), and specify whether the dimension is required.

Dimension Type Values
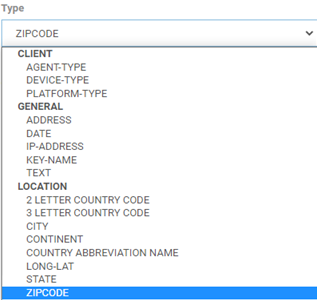
Dimensions can be one of the types shown below.

The dimensions are defined in Envision; then, in the Business Metrics policy, you can define how the dimension information is collected, using a regular expression or other approach. For more information, see Using the Business Metrics Policy.
Note: When processing data, Envision verifies that the data matches the specified Type value. Invalid data types are discarded.
| Category | Type | Definition |
|---|---|---|
| Client | AGENT-TYPE | A property that can reference the client's user-agent information. |
| Client | DEVICE-TYPE | A property that can reference the client's device type. |
| Client | PLATFORM-TYPE | A property that can reference the client's platform type. |
| General | ADDRESS | A property that can reference an address. |
| General | DATE | A property that can reference a standard date format. |
| General | IP-ADDRESS | Standard format for an IP address. |
| General | KEY-NAME |
A dual-valued property with both an ID and a name. For example, if integrating with Policy Manager, a dimension can be an organization, which has an ID and a descriptive name. The engine groups metrics using the organization's ID. However, in the Envision user interface, organizations are displayed using the organization names, since users probably will not know the IDs. Example: AppID-AppName |
| General | TEXT | A property that can reference a string value (text). |
| Location | 2 LETTER COUNTRY CODE |
A property that can reference the standard two-letter abbreviation for a country, per ISO 3166-1. Example: US. For more information about standard two-letter country codes, and a list of valid values, see https://en.wikipedia.org/wiki/ISO_3166-1_alpha-2. |
| Location | 3 LETTER COUNTRY CODE |
A property that can reference a three-letter abbreviation for a country, per ISO 3166-1. Example: USA. For more information about standard two-letter country codes, and a list of valid values, see https://en.wikipedia.org/wiki/ISO_3166-1_alpha-3. |
| Location | CITY | A property that can reference a city. Example: London. |
| Location | CONTINENT | A property that can reference a continent. Example: Europe. |
| Location | COUNTRY ABBREVIATION NAME | A property that can reference an abbreviation for a country, if some system is in use other than two-letter or three-letter abbreviations. |
| Location | LONG-LAT | A property that can reference a geolocation (latitude/longitude). |
| Location | STATE | A property that can reference a US state. |
| Location | ZIPCODE | A property that can reference a US ZIP code. Example: 90025. |
If you specify a default value, and a dataset row does not include a value for the dimension, Envision adds the default value. The default value must be the same data type as the dimension. If the dimension is classified as required, any collector of data must include the dimension, or the data will not aggregate correctly and charts will likely not work well.
Each dimension in the list has a pull-down menu of options that can be performed on the dimension.

- Edit—Displays the pop-up used to create the dimension initially so that changes can be made (excluding the name, which cannot be changed).
- Delete—Removes the dimension from the dataset.
Custom Date Dimensions
If any metric or report uses a custom date as an Aggregate Operator, then the data is stored as per the custom date in MongoDB and can be used to create charts to show metrics. The custom date dimension allows you to update data with your own dimensions in Envision. You can have one or multiple date dimensions within a dataset, but only one date dimension can be selected for aggregation. A date dimension can be defined to specific timezones.
When using the custom date dimension, you need to consider the following options:
-
If the Aggregate Operator is configured with a custom date dimension and a default date dimension (default dimension name: "Create Time"), then a new rollup record will be created for each raw record. The records with the same unit of time (minutes, hours, days, weeks, months, years) will not be merged or aggregated even if multiple RAW records are available with the same custom date.
-
Remove the default date dimension if you want the data to be aggregated based on the custom date dimension.
-
If a custom date Aggregate Operator is configured and RAW records are created with a date older than Purge Intervals configured in the Envision Dataset Settings, then rollup records will get deleted immediately.
-
To retain the data for a longer period, the purge interval settings need to be updated appropriately.
-
The Group functionality for a Dataset is not supported with aggregation.
Metrics
The Metrics section lists all the metrics for the dataset. Metrics are the properties of a dataset that can be measured, aggregated, and compared.

Add New Metric
Each dataset is created initially with a single default metric, RequestCount. The RequestCount metric is the measure for the number of transactions, or orders in this example. The metric can be deleted if you do not wish to collect it.
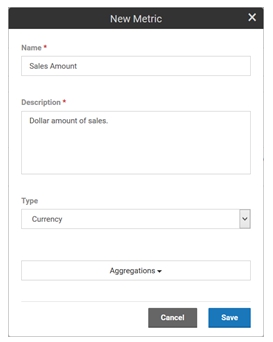
To add another metric select New Metric. A pop-up displays where you can enter a name, a description, a type, and a set of aggregation calculations to perform.

For available metric types, see Metric Type Values. The aggregation choices are average, sum, minimum, maximum, first, and last.
Metrics Options
Each metric in the list has a pull-down menu of options that can be performed on the metric.

- Edit—Displays the pop-up used to create the metric initially so that changes can be made (excluding the name, which cannot be changed).
- Delete—Removes the metric from the dataset.
Metric Type Values
Metrics can be any one of the following types:
- COUNT
- CURRENCY
- NUMBER
- SIZE
- TIME
Settings
The Settings section lists all the aggregation and storage intervals for the dataset.

The following settings are configurable:
- Aggregate Operator
- Timezones (specify timezone)
- Minute of data and keep it for (configure # + unit of measure. Default: 2 days)
- Hour of data and keep it for (configure # + unit of measure. Default: 1 week)
- Day of data and keep it for (configure # + unit of measure. Default: 1 month)
- Week of data and keep it for (configure # + unit of measure. Default: 6 months)
- Month of data and keep it for (configure # + unit of measure. Default: 2 years)
- Year of data and keep it for (configure # + unit of measure. Default: 10 years)
Envision supports aggregating metrics every minute, hour, day, week, month, and/or year. For each of these aggregation sets, you can also specify how long the results should be held in the data store. This is done by selecting a unit of time (minutes, hours, days, weeks, months, years) and a number of units.
In the example above, the metrics will be aggregated on a weekly and monthly basis. The weekly results will be held in the data store for 1 year and the monthly results will be held in the data store for 5 years.
It is important to think about how these intervals will limit the ability to make charts. It is not possible to create a chart with data points more granular than the aggregations calculated. Once again in our example you could not create a chart that shows metrics for shoe orders per minute or day.