Using the Business Metrics Policy
Learn how to specify what business metrics should be gathered from the contents of messages being exchanged.
For information about using policies in the context of the Community Manager developer portal, see Business Policies.
On this page:
- Introduction
- Prerequisites
- Configuration Options
- Extraction Examples
- Derivation Expression Types
- Test Message
- Activating a policy
- Attaching a policy
- Business Metrics Policy Use Cases
Introduction
The Business Metrics Policy specifies what business specific metrics should be gathered from the contents of the messages being exchanged. The information collected is not general to all messages but very specific, using data from message payloads, headers, or URLs.
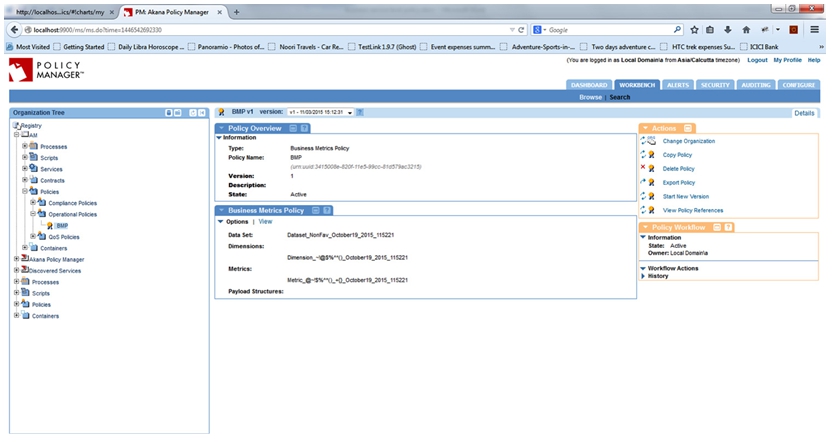
The Business Metrics Policy Details page displays a summary of the policy configuration including:
- Dataset—Name of the dataset the policy collects metrics for.
- Dimensions—List of dimensions the policy is collecting.
- Metrics—List of metrics the policy is collecting.
- Payload Structures—List of payload structures that will be extracted from the request or response.
Prerequisites
- Completion of the Policy Manager / Envision Integration Installation. Note that this policy is used with the Envision product and is installed as part of the Envision Console Extension Feature which is included in this installation.
- MongoDB must be started to log into the Policy Manager Management Console and modify a Business Metrics Policy.
- A dataset must be previously defined so it can be selected as part of the policy configuration. Datasets can be defined using the Envision Console, or can be imported into MongoDB.
Configuration Options
This section provides details about the pages of the Business Metrics Policy wizard:
- Select Dataset page
- Define Payload Structures page
- Define Variables page
- Define Dimensions page
- Define Metrics page
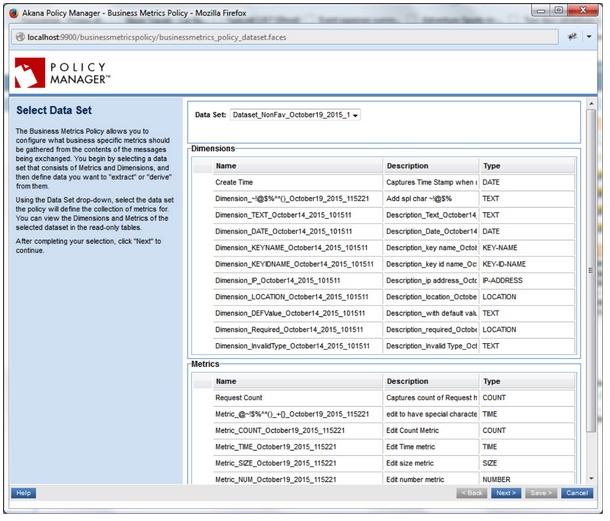
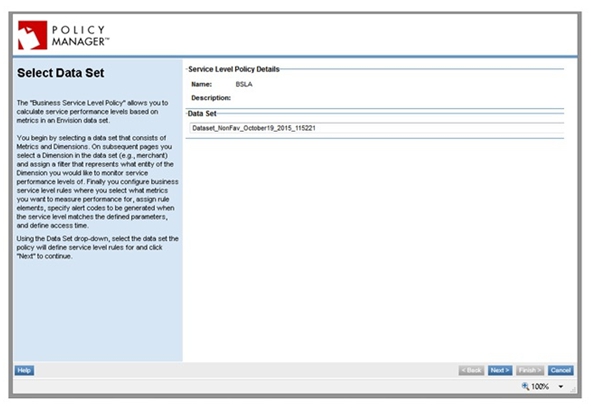
Select Dataset page
This screen allows you to select the dataset the policy will define the collection of metrics for and then define data you want to extract or derive from them. Data displayed for datasets is read only.
Dataset Drop-Down
- Allows you to select a dataset. Available datasets are those created using the Envision Console or imported into MongoDB.
- The dataset selected determines what Dimensions and Metrics will be collected.
- You can view the Dimensions and Metrics of the selected dataset in the read-only tables.
Define Payload Structures page
This screen allows you to configure payload structures. By default, the entire request and response body content (payloads) can be used as the context from which to extract information. However in some cases the payloads may be complex with 0 to many nested structures.
- When extracting multiple items from nested structures it may be important to preserve the relationships between those items.
- For example, a purchase transaction may have multiple nested item structures with both a name and a price.
- You could collect two separate arrays of names and prices easily, but if you want to match the prices collected with their names you will need to identify the item as a payload structure on the page.
You define a Payload structure using the Add function, and identify what portion of the message will be extracted (the Source) using a path language.
Configuration Options
- Add—Define a payload structure by specifying Name and optional Description.
- Delete—Delete a payload structure by highlighting row.
- Source—Identify if the structure will be extracted from the Request, Response, or Fault portion of a message.
- Path—Specify the method used to identify the location of the structure using XPath, JSONPath, or RegEx path languages.
- Test Message—Specify the test message to be used for testing expressions in the text box. Test messages are optional.
- Apply—Button that applies the values in the Extraction instructions or Derivation Instructions to the selected row in the Payload Structures Table.
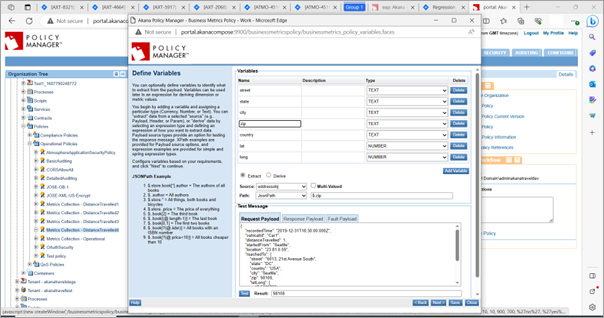
Define Variables page
You can optionally define variables to identify what to extract from the payload. Variables can be used later in an expression for deriving dimension or metric values.
- You begin by adding a variable and assigning a particular type (Currency, Number, or Text).
- You can “extract” data from a selected “source” (for example, Payload, Header, or Param), or “derive” data by selecting an expression type and defining an expression of how you want to extract data.
- Payload source types provide an option for testing the response message. XPath, JSONPath, and RegEx examples are provided for Payload source options, and expression examples are provided for simple and spring expression types.
Define Variables page: configuration options
- Variables Table—Holds the variables used by other variables, dimensions, or metrics. The table cells are editable.
- Name—Variable name.
- Description—Variable description. This field is optional.
- Type—Drop down menu of available types of variables, such as 2 LETTER COUNTRY CODE, DATE, or TEXT. The most commonly used type is TEXT. For a full list of available values, and explanations, see Dimension Type Values.
- Add—Adds a new row in the Variables table.
- Delete—Deletes the selected row. Any variable, dimension, or metric definitions that reference the deleted variable will be deleted.
- Extract—Radio button displays the Extraction Instructions for the highlighted row in the Variables table.
- Source—Drop down for selecting the Request Header, Response Payload, Response Header, Fault Payload, Fault Header, Form Param, Path Param, and Query Param.
- Path—Specify the method used to identify the location of the structure using XPath, JSONPath, or RegEx path languages.
- Multi-Valued—Check-box enables the Multi-Valued Aggregation Pull. Options include Number of Records, Get First, and Get Last.
- Name (text box)—Enter query or path parameter name to extract from. Only visible if the Source is Query Param, Form Param, or Path Param.
- Name (drop-down)—Select area of header to extract from. Only visible if the Source is Header.
- Test Message—Specify the test message to be used for testing expressions in the text box. Test messages are optional.
- Derive—Radio button that displays the Derivation Instructions for the highlighted row in the Variables table. Options include Constant, Simple Expression, Spring Expression, and Operational Dimension.
- Derivation—For Constant, Simple Expression, or Spring Expression options, enter a definition in the text box. For Operational Metric or Operational Dimension select a metric or dimension from the drop-down.
- Use the Test button to perform the expression in the Derivation Text Box against the sample message identified by the Source Pull Down.
- The results will display in the text box.
- Apply—Button that applies the values in the Extraction or Derivation Instructions to the selected row in the Variables table.
- Clear—Clears the contents of the selected table row.
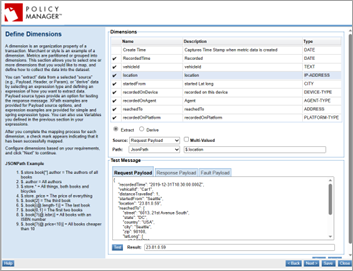
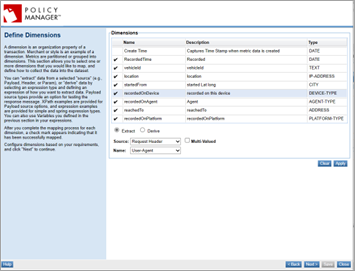
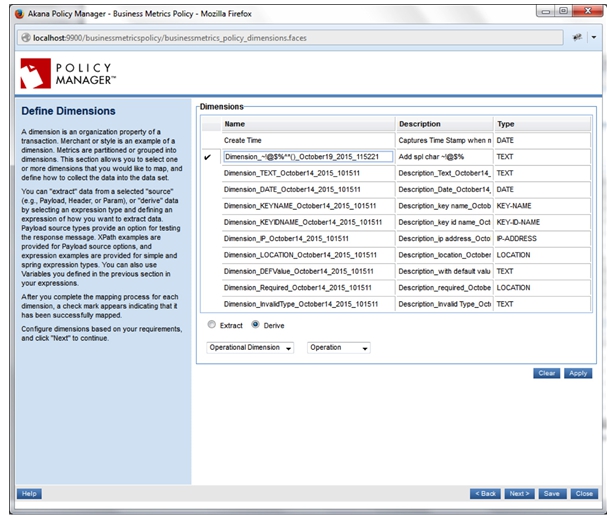
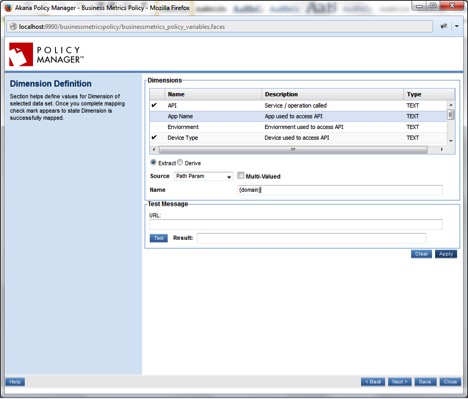
Define Dimensions page
A dimension is an organization property of a transaction. Merchant or style is an example of a dimension. Metrics are partitioned or grouped into dimensions. This section allows you to define the constructions of dimensions in the dataset by selecting one or more dimensions that you would like to map, and defining how to collect the data into the dataset.
- You can “extract” data from a selected “source” (for example, Payload, Header, or Param), or “derive” data by selecting an expression type and defining an expression of how you want to extract data.
- Payload source types provide an option for testing the response message. XPath examples are provided for Payload source options, and expression examples are provided for simple and spring expression types.
- You can also use Variables you defined in the previous section in your expressions.
Define Dimensions page: configuration options
- Dimensions Table—Table that holds the dimensions collected. The cells of the table are not editable. The available dimensions are based on the dataset specified on the Select Dataset page. An example is shown below.

Fields:
- Name—Dimension name.
- Description—Dimension description. This field is optional.
- Type—Dimension type. Possible types include Currency, Number, Location, Text, Date, and Multi-Valued.
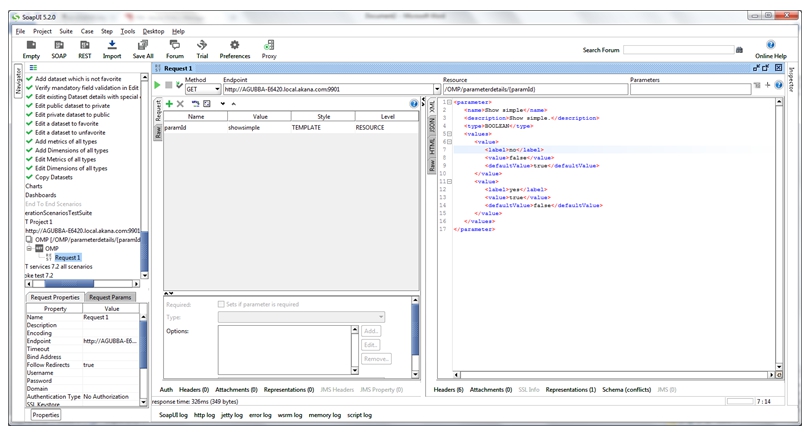
- Extract—Radio button displays the Extraction Instructions for the highlighted row in the Dimensions table, as shown in the example above.
- Source—Specify the part of the message that the dimension will be extracted from: Request Header, Response Payload, Response Header, Fault Payload, Fault Header, Form Param, Path Param, or Query Param.
- Name (text box)—Enter query or path parameter name to extract from. Only visible if the Source is Query Param, Form Param, or Path Param.
- Name (drop-down)—Select area of header to extract from. Only visible if the Source is Header.
- Path—Specify the method used to identify the location of the structure using XPath, JSONPath, or RegEx path languages.
- Multi-Valued—Check-box enables the Multi-Valued Aggregation Pull. Options include Number of Records, Get First, and Get Last.
- Test Message—Specify the test message to be used for testing expressions in the text box. Test messages are optional.
- Derive—Radio button that displays the Derivation Instructions for the highlighted row in the Dimensions table, as shown in the example below.

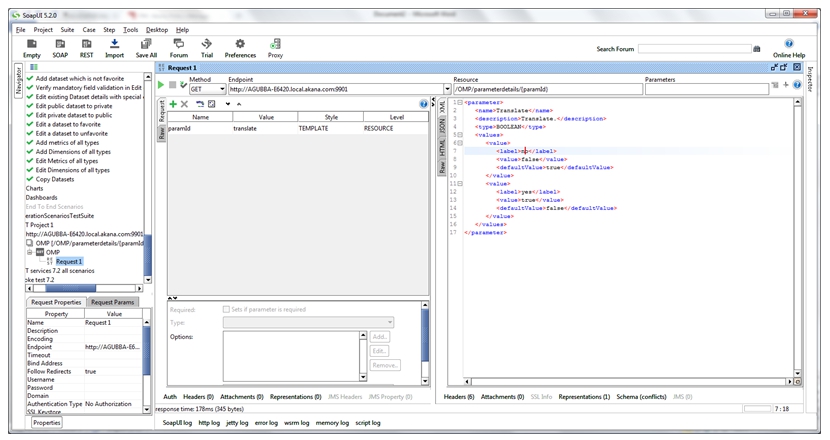
Options include Constant, Simple Expression, Spring Expression, and Operational Dimension.
- Derivation—For Constant, Simple Expression, or Spring Expression options, enter a definition in the text box. For Operational Metric or Operational Dimension select a metric or dimension from the drop-down. The example below shows the values available for Operational Dimension:

- Use the Test button to perform the expression in the Derivation Text Box against the sample message identified by the Source Pull Down.
- The results will display in the text box.
- Derivation—For Constant, Simple Expression, or Spring Expression options, enter a definition in the text box. For Operational Metric or Operational Dimension select a metric or dimension from the drop-down. The example below shows the values available for Operational Dimension:
- Apply—Button that applies the values in the Extraction or Derivation Instructions to the selected row in the Dimensions table.
- Clear—Clears the contents of the selected table row.
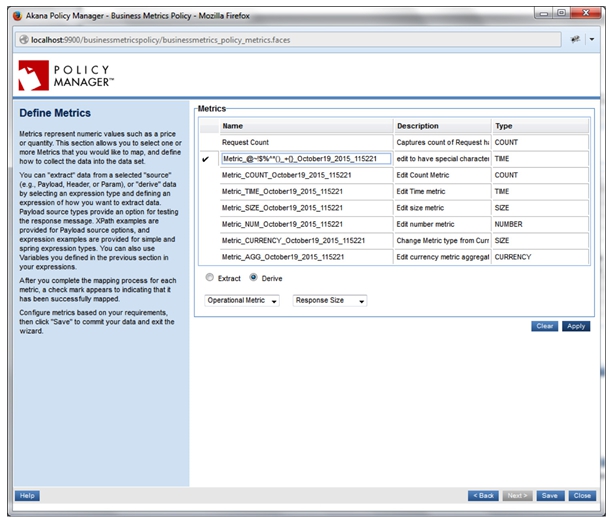
Define Metrics page
Metrics represent numeric values such as a price or quantity. The Metrics section allows you to select one or more Metrics that you would like to map, and define how to collect the data into the dataset.
- You can “extract” data from a selected “source” (for example, Payload, Header, or Param), or “derive” data by selecting an expression type and defining an expression of how you want to extract data.
- Payload source types provide an option for testing the response message. XPath examples are provided for Payload source options, and expression examples are provided for simple and spring expression types.
- You can also use Variables you defined in the previous section in your expressions.
The Metrics section displays the following read-only metrics information of the selected dataset:
- Metrics Table—Table that holds the metrics collected. The cells of the table are not editable. They are filled when the page is displayed based on the dataset selected on the Select Dataset page.
- Name—Metric name.
- Description—Metric description.
- Type—Metric type. Possible types include Currency, Number, Location, Text, Date, and Multi-Valued.
- Extract—Radio button displays the Extraction Instructions for the highlighted row in the Metrics table.
- Source—Drop-down for identifying if the metric will be extracted from the Request Header, Response Payload, Response Header, Fault Payload, Fault Header, Form Param, Path Param, or Query Param portion of the message.
- Name (text box)—Enter query or path parameter name to extract from. Only visible if the Source is Query Param, Form Param, or Path Param.
- Name (drop-down)—Select area of header to extract from. Only visible if the Source is Header.
- Multi-Valued—Check-box enables the Multi-Valued Aggregation Pull. Options include Number of Records, Get First, Get Last, Get Maximum, Get Minimum, Add All
- Path—Specify the method used to identify the location of the structure using XPath, JSONPath, or RegEx path languages.
- Test Message—Specify the test message to be used for testing expressions in the text box. Test messages are optional.
- Derive—Radio button that displays the Derivation Instructions for the highlighted row in the Metrics table. Options include Constant, Simple Expression, Spring Expression, and Operational Metric.
- Derivation—For Constant, Simple Expression, or Spring Expression options, enter a definition in the text box. For Operational Metric or Operational Dimension select a metric or dimension from the drop-down.
- Use the Test button to perform the expression in the Derivation Text Box against the sample message identified by the Source Pull Down.
- The results will display in the text box.
- Apply—Button that applies the values in the Extraction or Derivation Instructions to the selected row in the Dimensions table.
- Clear—Clears the contents of the selected table row.
Extraction Examples
Request, Response, and Fault Payload Examples
- XPath Example

- JSONPath Example

- RegEx Example

Derivation Expression Types
After you select the Derive radio button, the following expression types can be selected.
- Constant—Indicates the content of the Derivation Text Box is a constant value. A constant value can be:
- A number
- A string
- An array of numbers/strings in the form of: 1, 2, 3 or “ a”, “b”, “c”
- A map of numbers/strings to numbers/strings in the form of: “a”=1, 2=”b”, “c”=”d”
-
Simple Expression—Indicates the content of the Derivation Text Box is a mathematical expression. The functions available are addition, subtraction, multiplication, division, and modulus.

-
Spring Expression—Indicates the content of the Derivation Text Box is a valid expression string.

-
Operational Dimension—Allows you to define the derive instructions for the selected Dimension by selecting a property of the dataset from a drop-down menu.

Test Message
- Test Message—Specify the test message to be used for testing expressions in the text box. Changes made on the current page are available on subsequent pages. Test messages are optional. Option available for: Request Payload, Response Payload, and Fault Payload.
- URL—Specify a sample URL including query parameters. Option available for: Path Param.
Activating a policy
When you create and configure a policy, the policy is in Draft state. When the policy configuration is complete, activate the policy: click Activate Policy and then confirm. See Activate a Policy.
A policy in Draft state is not available for general use. Once you activate the policy, it is in Active state and is available for use.
Attaching a policy
To use the policy, go to the Policies folder in the respective organization and attach the policy to a web service, binding, or binding operation.
Business Metrics Policy Use Cases for Envision
This section provides Business Metrics Policy use cases for walk-through tutorials on adding and configuring a Business Metrics Policy in Envision.
It includes:
- Configuring a Business Metrics policy to set SLA for a service
- Extracting Business Information from Service Usage Data Using Path Parameters
- Extracting Business Information from Service Usage Data Using XPath/JSONPath/RegEx
Configuring a Business Metrics policy to set SLA for a service
The following use case illustrates how to configure a Business Metrics policy to set SLA for a service. This example also uses the Business Service Level policy.
To configure a Business Metrics policy to set SLA for a service
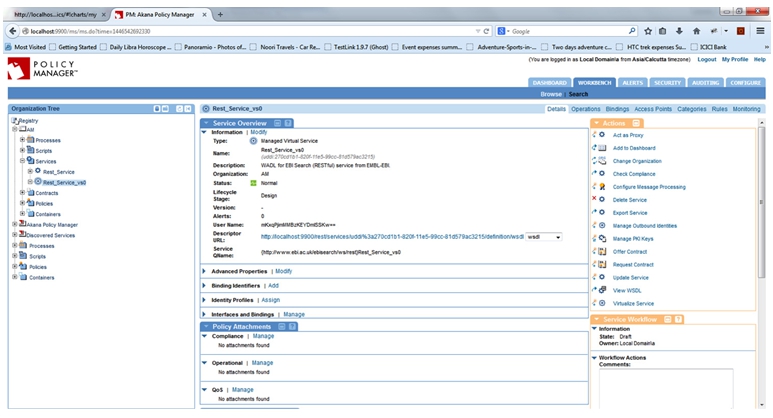
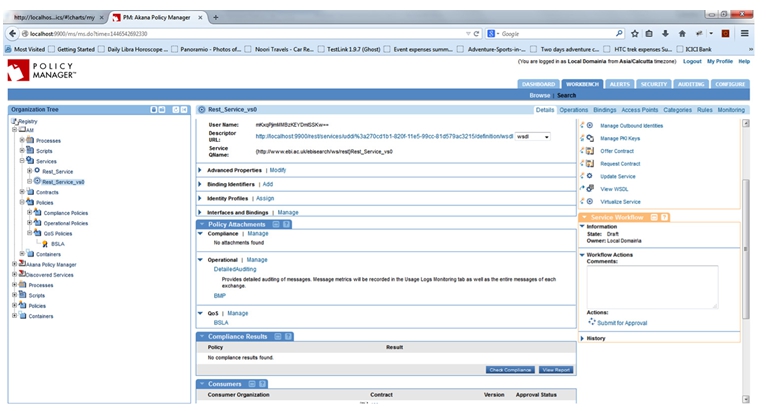
- Create a physical service.
- Virtualize the physical service.
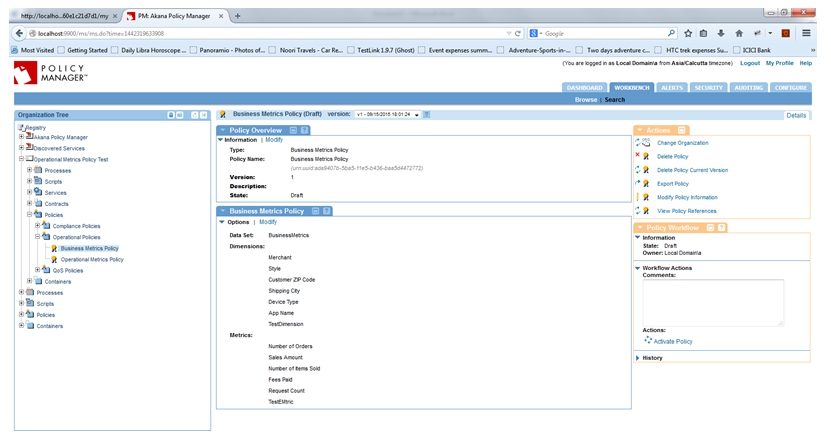
- Configure the Business Metrics Policy:
- Select any dataset.
- Provide dimensions and metrics configuration:
- Activate the policy.
- Select any dataset.
- In the Policies > QoS section, click Add Policy to configure a Business Service Level Policy.
- Select the dataset you created, as shown below:
- Select Filters (by dimensions).
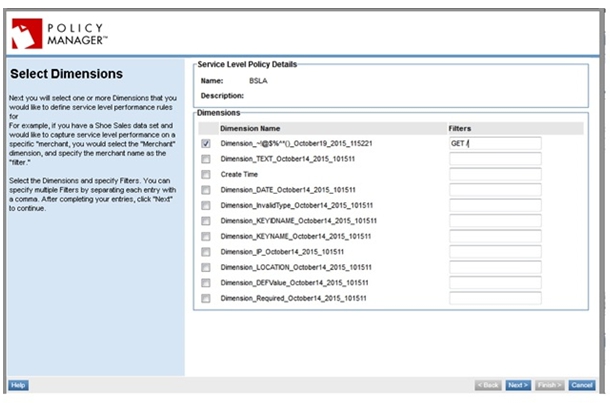
- Select desired condition based on the metrics in the dataset (data is loaded into the metrics as per the configuration in Business Metrics Policy).
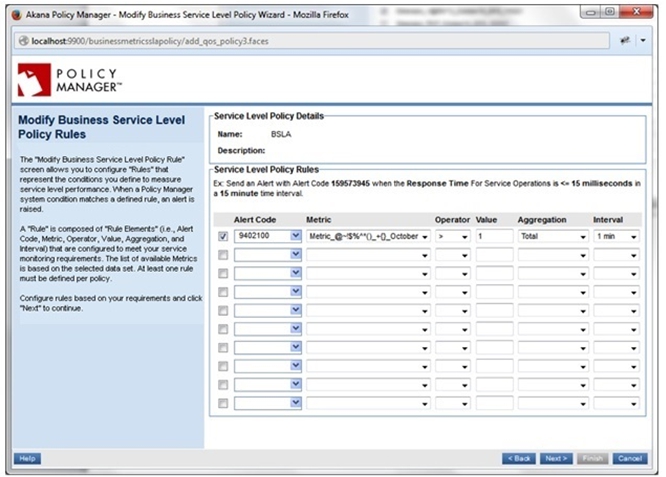
- Select the alert code.
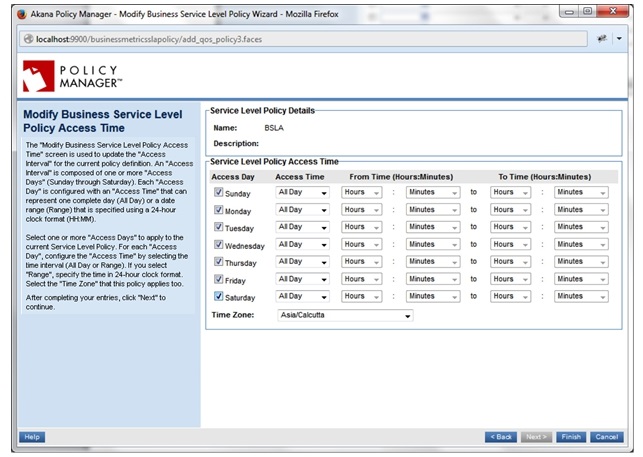
- Select the Days and Durations for which the alert will be triggered.
- Activate the policy.
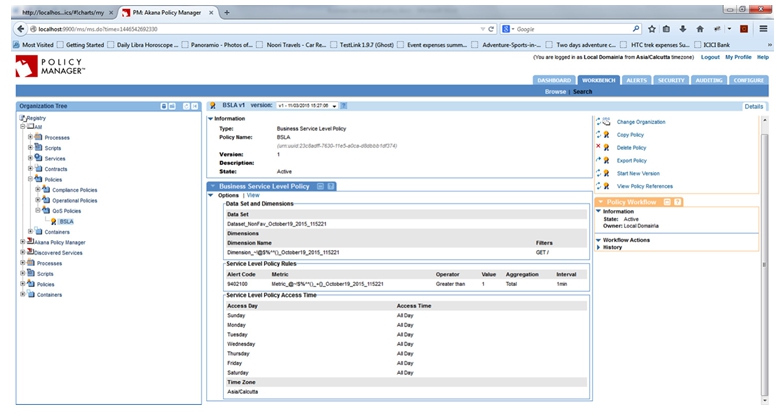
- Select the dataset you created, as shown below:
- In the Operational Policies section, attach the Business Metrics Policy.
- In the QoS Policies section, attach the Business Service Level Policy.
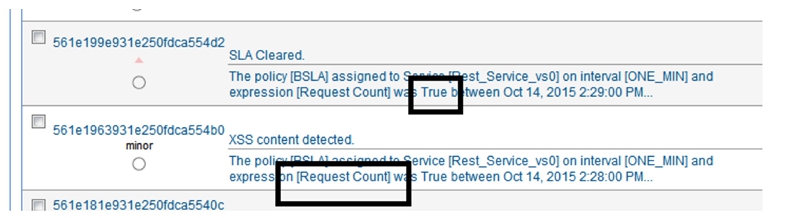
- Send several requests to the virtual service so that the condition described in the Business Service Level Policy is crossed.
- See alerts at the service level.
- See SLA cleared alerts at the service level. The results should be similar to the illustration below.
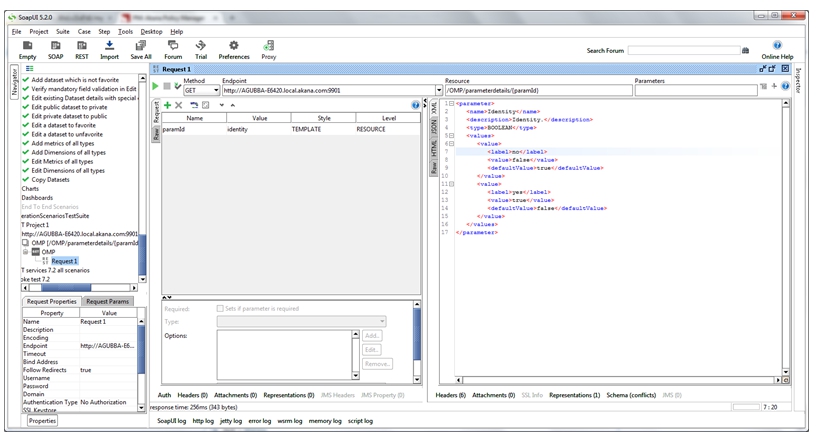
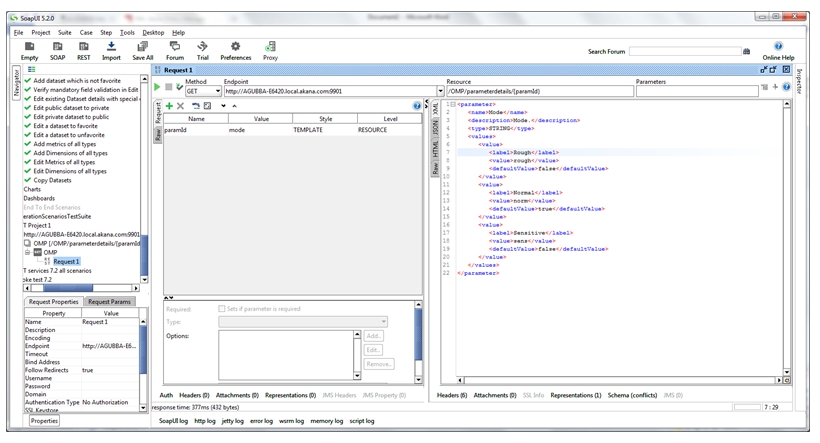
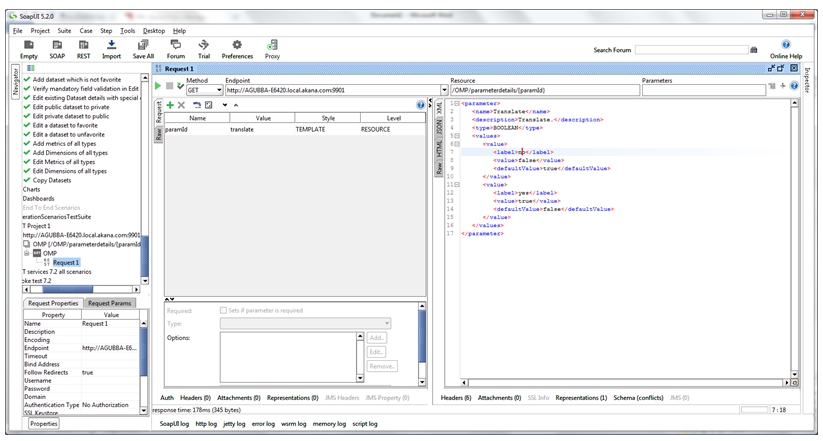
Extracting Business Information from Service Usage Data Using Path Parameters
The following use case illustrates how to use the Business Metrics Policy to extract business information from service usage data from path parameters.
To Extract Business Information from Service Usage Data Using Path Parameters
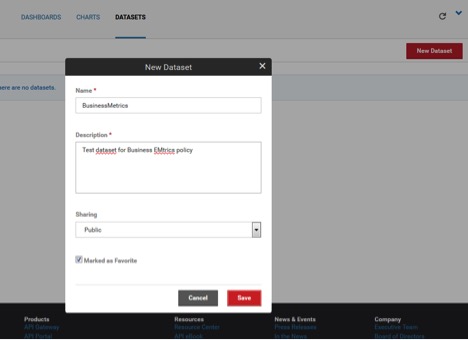
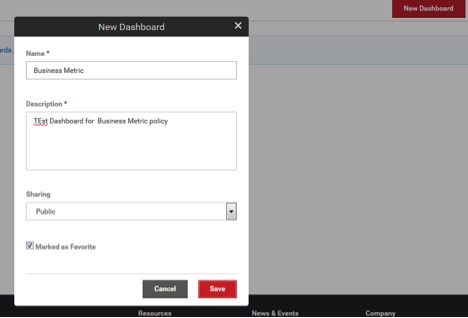
- Launch the Envision Console, select New Dataset, and define a dataset with sharing set to Public.

- In the new dataset, select New Dimension and define a dimension with the TEXT type.
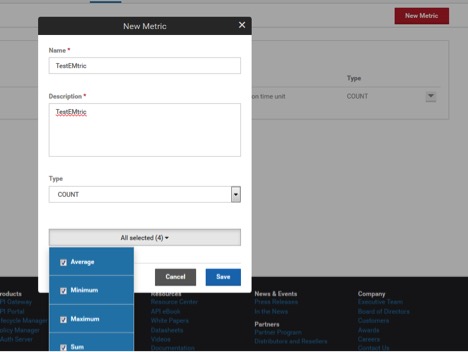
- In the same dataset, select New Metric and define a metric with the COUNT type and all aggregations.

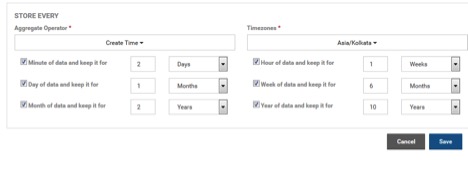
- Save aggregation settings for the selected dataset.

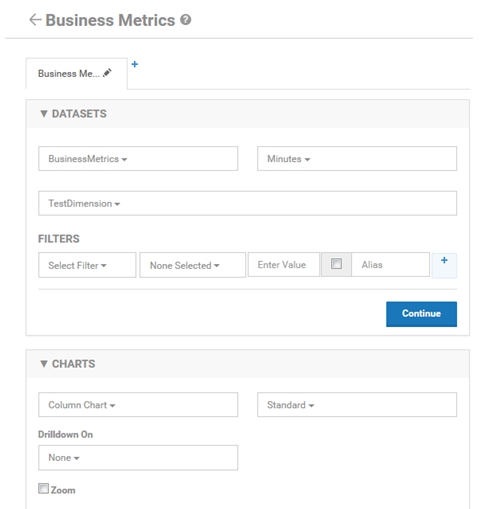
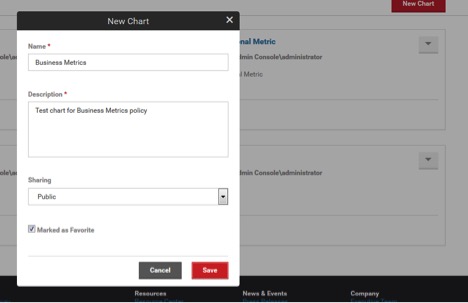
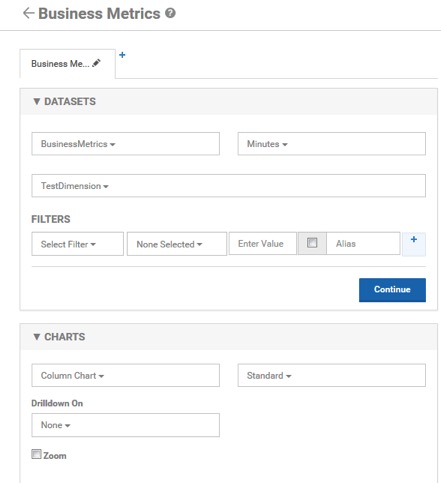
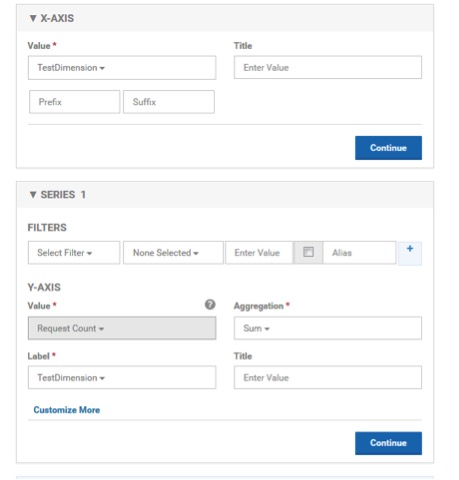
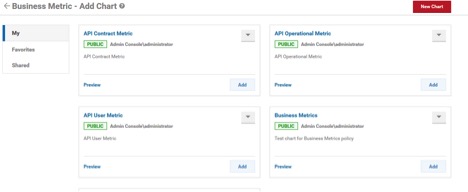
- Select New Chart, and create a chart using this dataset with the following configuration:


- Select New Dashboard, and create a dashboard with the newly defined chart:


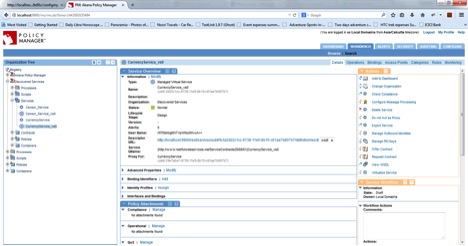
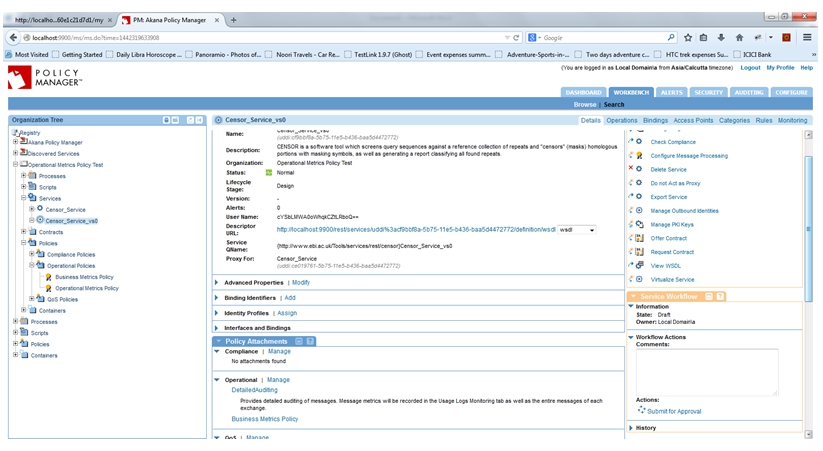
- Launch the Policy Manager Management Console, and create a service using the WADL file at this address: http://www.ebi.ac.uk/Tools/services/rest/censor?wadl (help for this service: http://www.ebi.ac.uk/Tools/webservices/services/so/censor_rest).
- Virtualize the service on the Network Director.
- Navigate to Policies > Operational and click Add Policy, then create a Business Metrics policy.
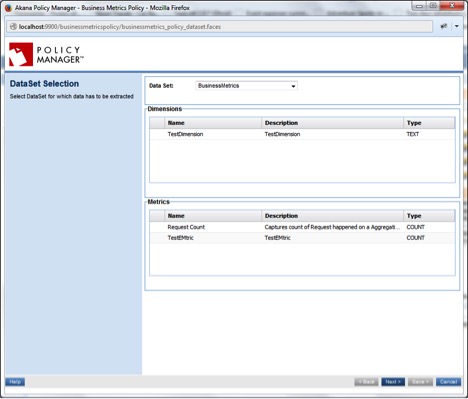
- Configure the policy, selecting the dataset you defined earlier, as shown below.

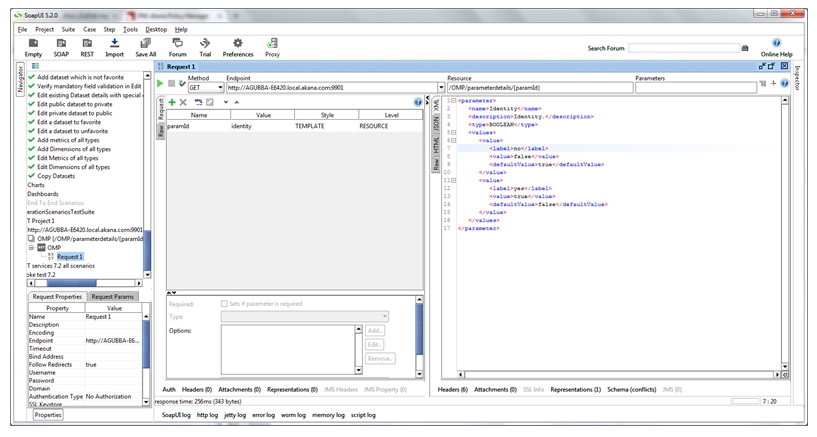
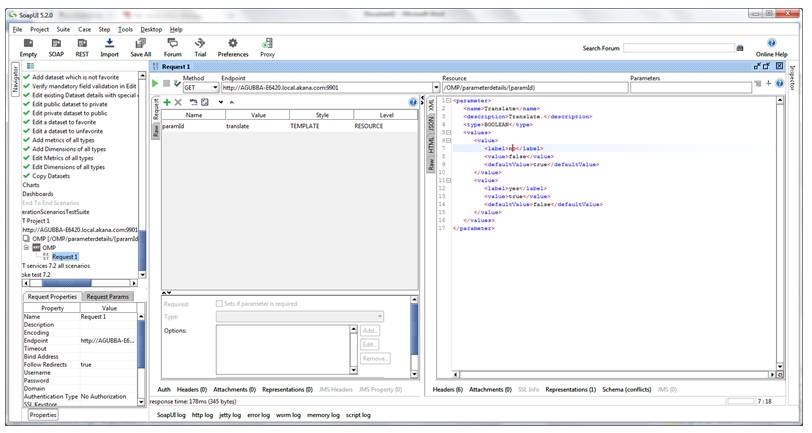
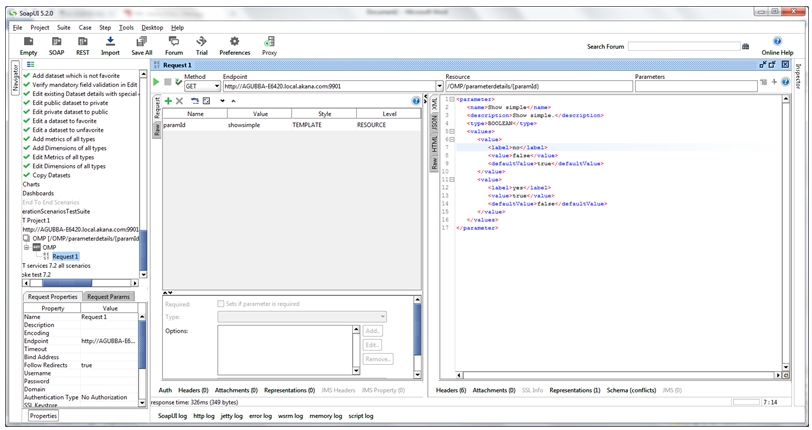
- Provide Extract/Derive Configuration for each of the dimensions and metrics using the example illustrated below:
- Dimension using Extract—To obtain a value in path parameters.
- Metric using Derive—To obtain usage count.

- Dimension using Extract—To obtain a value in path parameters.
- Attach the policy to the service.

- Send multiple requests to generate data for various cases.
- Check the data to be recorded in MongoDB and Dataset. The data should be appropriate per the requests sent.
- The chart should record information based on the data generated in the datasets from the above requests.
Extracting Business Information from Service Usage Data Using XPath/JSONPath/RegEx
The following use case illustrates how to use the Business Metrics Policy to extract business information from the service usage data using XPath/JSONPath/RegEx from the request payload and derive operational metric values.
To Extract Business Information from Service Usage Data Using XPath/JSONPath/RegEx
- Launch the Envision Console, select New Dataset, and define a dataset with sharing set to Public.
- In the new dataset, select New Dimension and define a dimension with the TEXT type.

- In the same dataset, select New Metric and define a metric with the COUNT type and all aggregations.
- Save aggregation settings for the selected dataset.
- Select New Chart, and create a chart using this dataset with the following configuration:
- Select New Dashboard, and create a dashboard with the newly defined chart:

- Launch the Policy Manager Management Console, and create a service using the WSDL file at this address: http://www.restfulwebservices.net/wcf/CurrencyService.svc?wsdl7.
- Virtualize the service on the Network Director.
- Navigate to Policies > Operational and click Add Policy, then create a Business Metrics policy.
- Configure the policy, selecting the dataset you defined earlier, as shown below.
-
Provide Extract/Derive Configuration for each of the dimensions and metrics using the example illustrated below:
- Dimension using Extract—To obtain a value in request payload using XPath/JSONPath/RegEx.
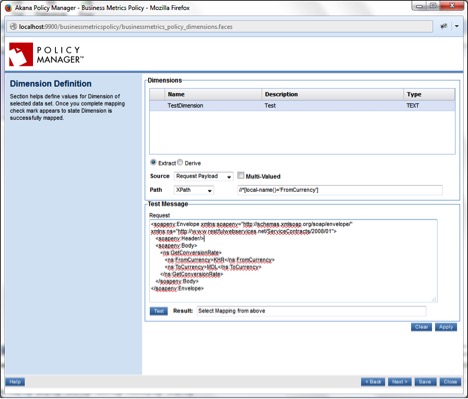
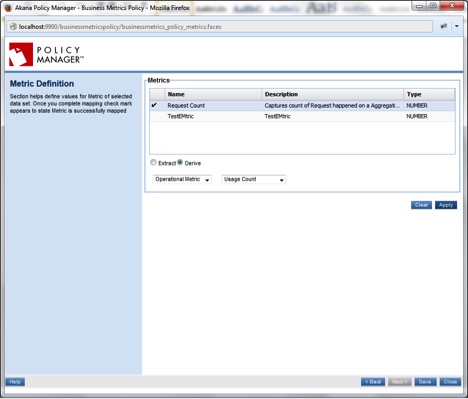
- Metric using Derive—To obtain usage count.
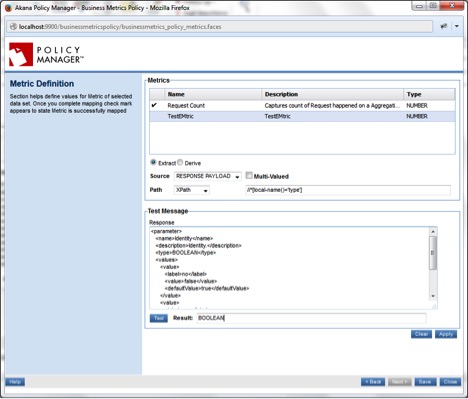
- Dimension using Extract—To obtain a value in request payload using XPath/JSONPath/RegEx.
- Attach the policy to the service.
- Send multiple requests to generate data for various usage scenarios.

- Check the data to be recorded in MongoDB and Dataset. The data should be appropriate per the requests sent.
- The chart should record information based on the data generated in the datasets from the above requests.
Extracting Location Information from IP Address
The following use case illustrates how to use the Business Metrics Policy to extract location information from the IP address.
To Extract Location Information from IP Address
-
Launch the Envision Console, select New Dataset, and define a dataset.
-
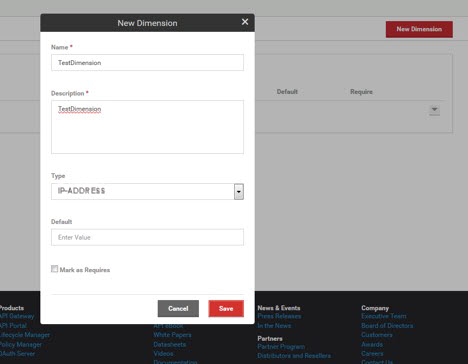
In the new dataset, select New Dimension and define a dimension with the IP-ADDRESS type.
-
In the same dataset, select New Metric and define a metric with the COUNT type and all aggregations.
-
Save aggregation settings for the selected dataset.
-
Go to Policies > Operational and click Add Policy, then create a Business Metrics policy.
-
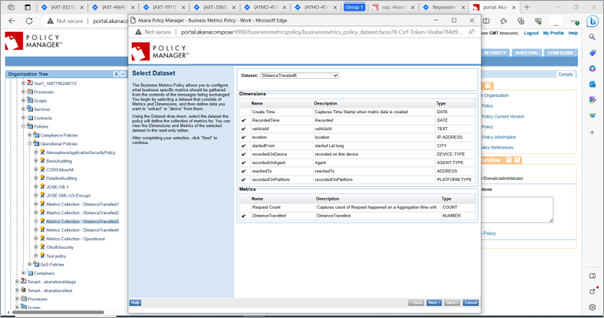
Configure the policy, selecting the dataset you defined earlier, as shown in the following image.
-
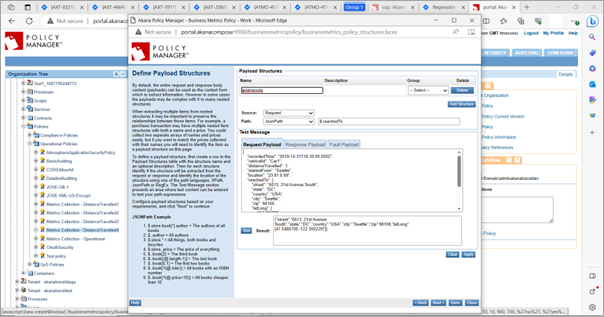
Define the payload structures for the address field.
-
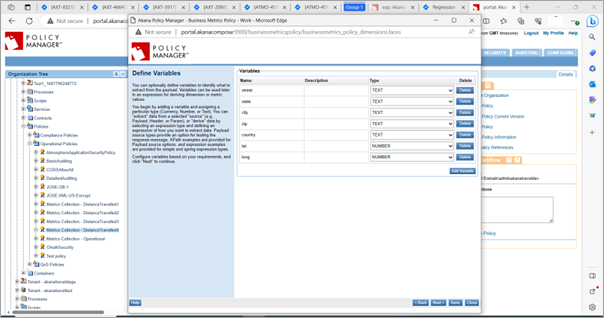
Define variables corresponding to the address fields.
-
Provide Extract/Derive Configuration for each of the dimensions and metrics using the example illustrated below.
-
Attach the policy to the service.
-
Check the data to be recorded in MongoDB and Dataset. The data should be appropriate per the requests sent.