Akana API Gateway Multi-Regional Deployment
Find out how to configure a multi-regional deployment with MongoDB.
On this page:
- Overview
- Multi-regional architecture
- Setting up the data stores
- API Gateway installation and configuration
- Sample configuration file
Overview
A single API Gateway deployment can span multiple regions around the globe to improve regional performance as well as provide a more seamless disaster recovery. To achieve better performance, all messages from a specific region should be brokered by a Network Director in the same region. For disaster recovery, it must be possible to access both the Network Director and Policy Manager in a different region if the local region has suffered a disaster.
The API Gateway does not support a full deployment with multiple primary containers across regions. Instead, it supports:
- Deployment of multiple primary instances for the Network Director processes.
- A primary/secondary deployment for the Policy Manager processes.
In each region, of course, the Network Director and Policy Manager processes can be deployed in clusters for scaling.
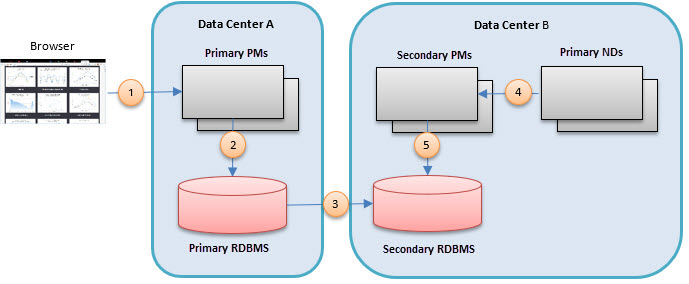
In the sample scenario in this document, the regional locations to which the API Gateway components are deployed are data centers. The diagram below illustrates the mixture of multi-primary Network Directors with primary/secondary Policy Managers.
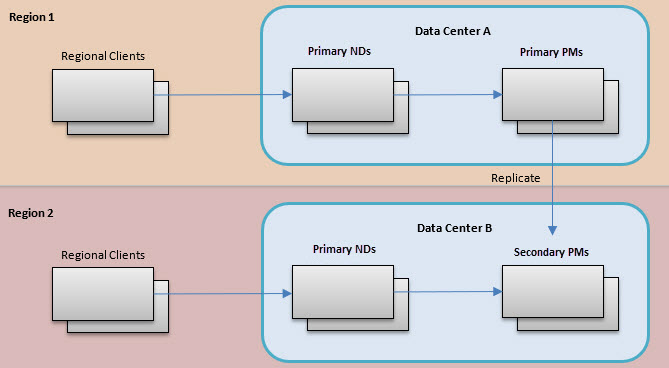
Each region has its own data center, with primary Network Directors that regional clients interact with. These Network Directors communicate with Policy Manager containers in the same region. Only one data center (Data Center A) has the primary Policy Manager container. All other data centers have secondary Policy Manager containers.
Multi-regional architecture
The key to a multi-regional software deployment is the speed of access to, and integrity of, persisted data. The API Gateway has traditionally persisted its data in a relational database. Although some relational database vendors claim multi-primary capabilities, these solutions have not proven to be 100% reliable. Instead, a more traditional primary/secondary deployment has proven to be the best option. For this reason, the multi-regional architecture includes a single primary Policy Manager.
This section includes:
- Primary/secondary deployment
- Incorporation of NoSQL databases that use sharding
- Propagating Network Director configuration information
- How Policy Managers gain read access to Network Director data written to local NoSQL shards
Primary/secondary deployment
- One data center will host the primary RDBMS that the co-hosted Policy Manager processes will read from and write to.
- The RDBMS will use replication to propagate changes made through the primary Policy Manager to the secondary databases in the other data centers.
- The Policy Manager processes in data centers with secondary databases are secondary containers themselves, only supporting read activities, no writes.
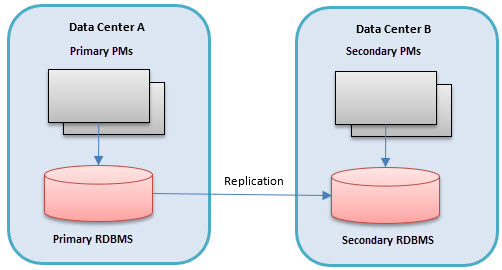
In case of a disaster that renders the data center that is hosting the primary Policy Manager or Policy Managers inoperable, the fail-over capabilities of the RDBMS are used to promote a different data center's database to be the new primary. The Policy Managers in this data center will now become the primaries as well.
The limitation of using a primary/secondary RDBMS for persisting data becomes an issue for the Network Directors. The goal of the Akana architecture is for the Network Directors in each data center to be primaries, meaning that they have the exact same functionality as any other Network Director in other data centers. This functionality includes the persisting of data. Examples of data that a Network Director persists, or writes, are:
- Metrics
- Usage logs and recorded messages
- Security audit trails
- Alerts
- Container state
Incorporation of NoSQL databases that use sharding
Using the primary/secondary RDBMS architecture for writing data would require the Network Directors in all data centers to communicate directly with the single primary Policy Manager/RDBMS. This would lead to obvious problems with performance, compounded by the volume of data needing to be written during heavy client traffic periods.
To avoid this limitation, the multi-regional architecture introduces a second persistence system, a NoSQL database, for the storage of the data that the Network Directors write. A NoSQL database supports sharding, and therefore provides more flexibility than an RDBMS. With sharding:
- Rows of the same table, or collection, can be stored in different servers in different data centers.
- The rows are segmented by a shard key.
- Each shard server is the primary of rows written with a certain set of keys.
- In the Akana architecture, the shard key is the Network Director key.
- Each shard can be the primary for multiple keys (to support Network Director clusters) but no more than one shard can be the primary for a single key.
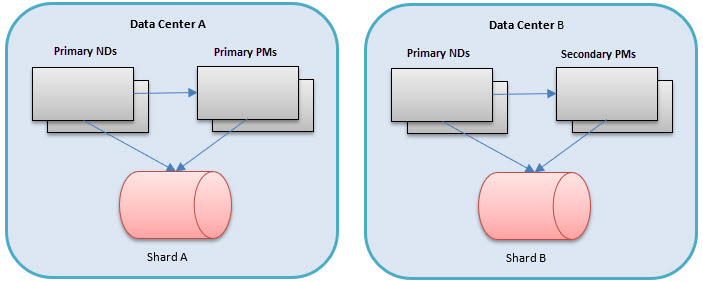
In the diagram above, each data center has its own shard of a NoSQL data store. For metrics and usage data the Network Director can write to the NoSQL database in either of two ways:
- Write directly to the shard.
- Use a RESTful service hosted by the Policy Manager which would write to the NoSQL shard.
For the other data, which the Network Director writes, there are services on the Policy Manager that the Network Director calls to insert the data into the shard. Note that even though the Policy Manager processes in data center B are secondary instances, they can still write to their local shard. This architecture tries to ensure good performance by keeping all database writes local to the same data center.
The use of the NoSQL database is very well suited for the data that the Network Director needs to write, because the data tends to be historical data that does not have relationships to other data in the Policy Manager data model that must be kept in sync. The data does reference the Policy Manager data model to reference containers, services, and operations, but there are no relational queries that Policy Manager needs to perform that would join with the historical data that the Network Director is writing.
Propagating Network Director configuration information
There is still a need for a relational stateful model for Policy Manager, which is why the RDBMS is still an important part of the architecture. The Network Director configuration information, such as listener and virtual service configuration, is persisted in the RDBMS. Therefore, the Network Directors still query their configuration indirectly through the Policy Manager to the RDBMS. When changes need to be made to the Network Director configuration, they must be made using another Policy Manager. The changes are then replicated to the secondary database servers, so that Network Directors needing that information in different data centers can read it from their local secondary database server.
How Policy Managers gain read access to Network Director data written to local NoSQL shards
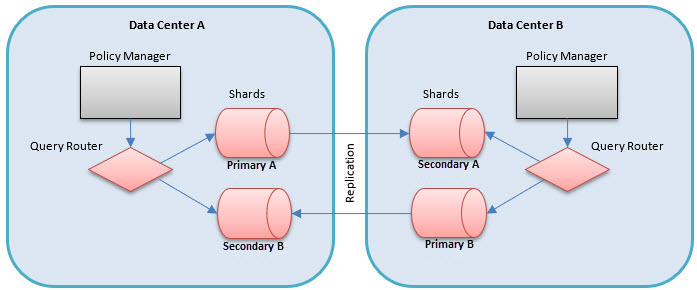
Although each ND is the primary for the records it writes to its local primary NoSQL shard, it is necessary for Policy Managers in different data centers to at least gain read access to that data. There are two options for how this can be achieved.
- Query Router: Having a query router in each data center ensures that any query made by a local Policy Manager for ND-written information is directed to the shards in the other data centers. The data is queried, possibly from multiple data centers, on the fly. This option requires no duplication of data through replication. The data is always assured to be current. However, read performance may suffer due to having to route to different data centers. Furthermore, if a data center is down the data will not be accessible at all.
- Replicated Content: Each primary shard replicates its content to other data centers. The other data centers have secondary shards. Having a query router in each data center ensures that any query made by a local Policy Manager for ND-written information is directed to the shards in the other data centers. This requires the duplication of data through replication. This provides the best performance for reads; however, if the replication is configured to be infrequent, queries may not get the most current information. This is the recommended option for the multi-regional architecture.
Setting up the data stores
Both a relational database and a NoSQL database must be installed and configured. The relational database is configured with a single primary and replication to the secondary data centers. Because the relational database vendor is a customer choice, the setup of the primary and secondary relational databases is out of scope for this guide. Please refer to the documentation from your vendor of choice.
The only NoSQL database vendor currently supported by the API Gateway is MongoDB. This section outlines the steps for setting up MongoDB instances in different data centers using sharding and replication.
For information on supported MongoDB versions, go to the System Requirements doc.
We highly recommend that you use MongoDB Enterprise Advanced, especially if you're running the API Gateway to support production or mission-critical applications. MongoDB Enterprise Advanced offers enterprise-grade security, operational automation, proactive support, and disaster recovery to run the API Gateway in a secure and reliable way.
This section includes:
- Configuration servers
- Query routers
- Database servers
- Arbiters
- Shards
- Database driver settings
- Troubleshooting
Configuration servers
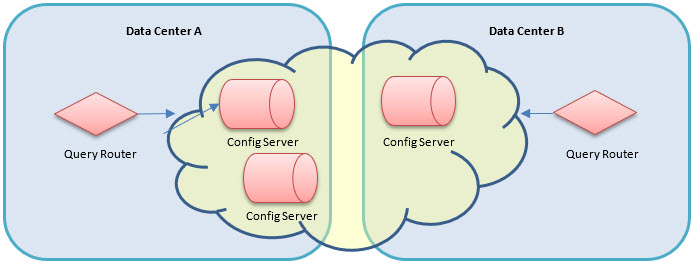
A cluster of sharded MongoDB instances requires a set of three configuration servers. In order to make sharding configuration changes, all three configuration servers must be available.
Notes:
- The MongoDB query routers will make use of these configuration servers for query routing.
- At least one configuration server will need to be available to a query router at all times.
- To ensure they are available for query routers in case of a disaster, it is recommended that the configuration servers be installed in the different data centers, along with the query routers in each data center.
- Remember that the three configuration servers need to be available for configuring the sharded cluster.
The following outlines the steps for setting up a configuration server.
Step 1 - Create a directory where the configuration server will store its data.
Step 2 - Create a configuration file that the configuration server will read on startup. This file will include the path to the data directory created in Step 1, the role of this process in the cluster, and the network address of the server. An example file is shown below.
01) storage:
02)     dbPath: /data/configdb
03) sharding:
04)     clusterRole: configsvr
05) net:
06)     bindIp: hostA
07)     port: 27019
In the above:
- On line 04, the cluster role is configsvr, which tells MongoDB to run as a configuration server and not as a database server.
- Lines 06 and 07 identify the host and port that the configuration server is listening on. The default port for all MongoDB processes is 27017.
Step 3: Start the configuration server process, referencing the config file as shown in the example below (where confserver.cfg is the name of the file created in Step 2):
mongod – config confserver.cfg
Repeat these steps for each of the configuration servers in the different data centers.
Query routers
A query router must be configured in each data center that will route inserts and queries to the correct database servers in the MongoDB cluster. The query routers must all use the same set of configuration servers, so that queries and inserts work on consistent data across the data centers. The following are the steps to configure a query router:
Step 1 - Create a configuration file that the query router will read on startup. The configuration file will include the addresses of the configuration servers and the network address of the server. An example file is shown below.
01) sharding:
02)     configDB: <replica set name>/hostA:27019,hostB:27019,hostC:27019
03) net:
04)     bindIp: hostA
05)     port: 27018
In the above:
- On Line 02, <replica set name> is the name of the replica set passed into the mongod --replSet parameter when starting the configuration database servers.
- Lines 04 and 05 identify the host and port that the query router is listening on.
- The default port for all MongoDB processes is 27017.
Step 2: Ensure all MongoDB databases that should be part of this deployment are stopped.
Step 3: Start the query router process, referencing the config file. An example is shown below.
mongos – config queryrouter.cfg
In the above:
- queryrouter.cfg is the name of the file created in Step 1.
Repeat these steps for each of the query routers in the different data centers.
Database servers
The server instances that hold the application data are called database servers. A set of multiple database servers that are reachable from a single query router make up a cluster. Database servers in a cluster can act as shards, or partitions of the application data, that can be used for horizontal scaling. Database servers in a cluster can also act as backups, or replicas, to either provide fault tolerance or read performance improvements.
- For fault tolerance, for each primary, the database should replicate its data to a secondary database in the same data center. This secondary database will become the primary should the original primary server go down.
- To enhance read performance in all data centers, the goal is to ensure that from a single data center no read or write is performed against a server in a different data center. All interactions with the data store are local to a single data center. At the same time, the API Gateway in a single data center should have read access to all data written by all data centers.
- To achieve this, each primary database will replicate its data to secondary databases in all the other data centers. When reads are performed, the query router of the local data center will direct the reads to the local primary database and the local secondary databases. The only data traffic between data centers is replication traffic.
There is one replica set for each primary database. The following are the steps for creating a database replica set.
Step 1 - Create a directory where the database server will store its data. Do this on the host for each database server.
Step 2 - Create a configuration file that the database server will read on startup. The configuration file will include the path to the data directory created in Step 1, the role of this process in the cluster, and the network address of the server. An example file is shown below.
01) storage:
02)     dbPath: /data/configdb
03) sharding:
04)     clusterRole: shardsvr
05) replication:
06)     oplogSizeMB: 10240
07)     replSetName: ShardA
08) net:
09)     bindIp: hostA
10)     port: 27017
In the above:
- Lines 03–04 are the sharding configuration. That is discussed in the next section, Shards.
- Lines 05–07 are the replication configuration.
- On Line 6, the oplogSizeMB is the amount of space available for performing replication, and should be roughly 5% of the total space used by the database.
- Line 07 gives a name to the replica set that this database is part of. There is one primary database for each data center and one replica set for each primary, so it's a good idea to name the replica set after the primary database's data center.
- Lines 09 and 10 identify the host and port that the shard server is listening on. The default port for all MongoDB processes is 27017.
Step 3: Start the database server process, referencing the config file, as shown in the example below.
mongod – config shardserver.cfg
Step 4: In each of the other data centers, create a secondary database. For fault tolerance, you can create more than one secondary database in each data center, including the same data center as the primary database. However, if you create a secondary database in the same data center as the primary, it is possible that the secondary database is used when performing reads, and the secondary database might have stale data. On each of the hosts for the secondary database, create new data directories for the replicated data.
Step 5: Create configuration files for each of the secondary shards in the local and remote data centers. The configuration files will include the path to the data directory created in Step 2, and will identify:
- The replica set they are part of.
- The network address of the server.
An example file is shown below.
01) storage:
02)     dbPath: /data/primaryconfigdb
03) sharding:
04)     clusterRole: shardsvr
05) replication:
06)     oplogSizeMB: 10240
07)     replSetName: ShardA
08) net:
09)     bindIp: hostC
10)     port: 27020
Note: On line 07, the replica set name must be the same as the one named for the primary database.
Step 6: Start the secondary databases.
Step 7: Connect to the admin shell of the primary database, as shown in the example below.
mongo hostA:27017/admin
Step 8: From the shell, designate the current database as the primary in the replicate set with the following command:
> rs.initiate()
Step 9: From the shell, add the secondary databases to the replica set with the rs.add command, as shown below.
> rs.add("hostC:27020")
In the above, the argument is the host and port of the secondary database.
Do this for each database in the replica set.
Step 10: From the shell, retrieve the replica set's configuration as it currently exists with the following:
> cfg = rs.config()
Assign the config to a variable, cfg, so that you can alter the configuration. The output of the command should look something like the following:
{
  "_id" : "ShardA",
  "version" : 3,
  "members" : [
    {
      "_id" : 0,
      "host" : "hostA:27017",
      "priority" : "1"
    },
    {
      "_id" : 1,
      "host" : "hostB:27017",
      "priority" : "1"
    },
    {
      "_id" : 2,
      "host" : "hostC:27017",
      "priority" : "1"
    }
  ]
}
Step 11: If you choose to create secondary replicas in the same data center as the primary, you can make sure that the local replicas have priority over replicas in other data centers for taking over the primary role if the primary goes down. To ensure that the remote replicas do not become the primary, change the priority property of each of the remote members to 0, as in the example shown below.
> cfg.members[2].priority = 0
In the above example, 2 is the _id of the remote secondary database.
Execute this command for each of the remote secondary databases in the configuration.
Step 12: From the shell, commit the configuration change with the following:
> rs.reconfig(cfg)
Arbiters
If there is an even number of replica servers in a replica set, you must create an arbiter. An arbiter is another mongod process, but it does not hold data. It must be run on a machine that is not already running a replica. To add an arbiter, perform the following steps.
Step 1 - Create a directory where the arbiter server will store its data.
Step 2 - Create a configuration file that the arbiter server will read on startup. The configuration file will include:
- The path to the data directory created in Step 1.
- The role of this process in the cluster.
- The network address of the server.
An example file is shown below.
01) storage:
02)     dbPath: /data/configdb
03)     journal.enabled: false
04)     smallFiles: true
05) sharding:
06)     clusterRole: shardsvr
07) replication:
08)     replSetName: ShardA
09) net:
10)     bindIp: hostD
11)     port: 27017
In the above:
- Lines 03–04 are specific to arbiters.
- Lines 05–06 are the sharding configuration. That is discussed in the next section, Shards.
- Lines 07–08 are the replication configuration.
- Line 08 gives a name to the replica set that the arbiter is part of.
- Lines 10 and 11 identify the host and port the shard server is listening on. The default port for all MongoDB processes is 27017.
Step 3: Start the arbiter server process, referencing the config file, as shown in the example below.
mongod – config arbiterserver.cfg
Step 4: From the shell of the primary server, add the arbiter to the replica set with the following command:
> rs.addArb("hostD:27017")
In the above, the only parameter is the host and port the arbiter was deployed on.
Shards
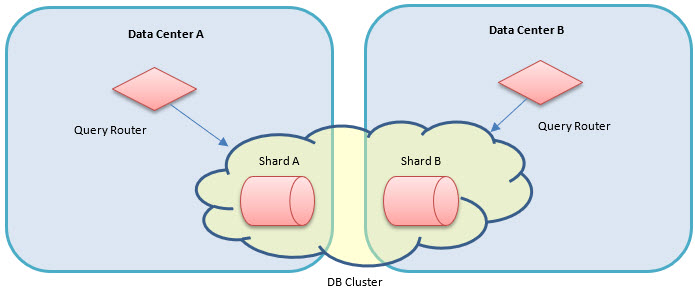
- Each data center will have at least one primary MongoDB database server instance.
- Each primary server is a shard.
- The collection of shards provides the complete set of application data.
- So far, this document has described a scenario that includes a single primary database, or shard, in each data center. However, it is possible to have multiple shards in a single data center.
- The query routers will direct inserts and queries to the server instances based on shard keys. In this architecture, the shard key is the key of the container generating the record to be stored.
To configure the shards, complete the following steps:
Step 1: Ensure the proper shard configuration exists in each database server's configuration file (including the secondary replica sets). The following properties should be found in each file:
01) sharding:
02)     clusterRole: shardsvr
Line 02 identifies this database server as a shard server and not a standalone database.
Step 2: Connect to the admin shell of the local query router, as shown in the example below.
mongo hostA:27018/admin
Step 3: From the shell, perform the following command for every shard to add to the cluster (including replica-set secondary instances):
> db.runCommand({addShard:"ShardA/hostA:27017", name: "shardA"})
The parameters are the shard address and shard name. The shard address is in the format of: <replica name>/<hostname>:<port>.
Step 4: From the shell, define shard tags. A shard tag is essentially an alias for the shards. You can define more than one shard in a tag, but in this example there is only one tag per shard. Execute the following command for each shard with its own tag name:
> sh.addShardTag("shardA", "ShardA")
Step 5: From the shell, enable sharding for each of the API Gateway databases, as shown in the example below.
> sh.enableSharding("PM")
> sh.enableSharding("PM_AUDIT")
> sh.enableSharding("METRIC_RAW_DATA")
> sh.enableSharding("METRIC_ROLLUP_DATA")
In the above, PM, AUDIT_LOG, METRIC_RAW_DATA, and METRIC_ROLLUP_DATA are the databases that the API Gateway uses.
Step 6: From the shell, enable sharding for each of the collections the API Gateway uses, as shown in the example below.
> sh.shardCollection("PM.ALERTS", { "containerKey" : 1 })
> sh.shardCollection("PM.CONTAINER_STATE", { "containerKey" : 1 })
> sh.shardCollection("PM.SECURITY_AUDIT_TRAIL", { "containerKey" : 1 })
> sh.shardCollection("PM.ALERT_AUDIT_TRAIL", { "containerKey" : 1 })> sh.shardCollection("PM_AUDIT.AUDIT", { "containerKey" : 1 })
> sh.shardCollection("PM_AUDIT.AUDIT_MSG",{"containerKey":1})> sh.shardCollection("PM_AUDIT.TRANSACTION_METRIC", { "containerKey" : 1 })
> sh.shardCollection("METRIC_RAW_DATA.OPERATIONAL_METRIC", { "containerKey" : 1 })
> sh.shardCollection("METRIC_ROLLUP_DATA.OPERATIONAL_METRIC", { "_id" : 1 })
In the above:
- The first argument of each command is the collection name prefixed by the database name.
- The second argument is a structure identifying the name of the property to use as the key and the type of property it is.
- PM_AUDIT.AUDIT_MSG is optional. See Audit_Msg information above.
Step 7: From the shell, designate the range of shard tags that should be directed to each shard. You can have a shard for each Network Director/Policy Manager container, one for the data center, or any combination in between. It is easier to have only one for the data center. The easiest approach is to create each of the Network Director/Policy Manager containers with numeric keys (for example, use keys 100–199 for data center A and 200–299 for data center B) so that one range can be configured only once. To define shard tag ranges, perform the following commands for each shard:
> sh.addTagRange("PM.ALERTS", { "containerKey": "100" }, { "containerKey" : "200" }, "ShardA")
> sh.addTagRange("PM.CONTAINER_STATE", { "containerKey" : "100" }, { "containerKey" : "200" }, "ShardA")
> sh. addTagRange("PM.SECURITY_AUDIT_TRAIL", { "containerKey" : "100" }, { "containerKey" : "200" }, "ShardA")
> sh. addTagRange("PM.ALERT_AUDIT_TRAIL", { "containerKey" : "100" }, { "containerKey" : "200" }, "ShardA")
> sh. addTagRange("PM_AUDIT.AUDIT", { "containerKey" : "100" }, { "containerKey" : "200" }, "ShardA")
> sh.addTagRange("PM_AUDIT.AUDIT_MSG",{"containerKey":"100"},{"containerKey":"199"}, "ShardTagA")> sh. addTagRange("PM_AUDIT.AUDIT_TRANSACTION_METRIC", { "containerKey" : "100" }, { "containerKey" : "200" }, "ShardA")
> sh. addTagRange("METRIC_RAW_DATA.OPERATIONAL_METRIC", { "containerKey" : "100" }, { "containerKey" : "200" }, "ShardA")
> sh. addTagRange("METRIC_ROLLUP_DATA.OPERATIONAL_METRIC", { "_id" : { "containerKey" : "100" } },
{ "_id" : { "containerKey" : "200" } }, "ShardA")
In the above:
- The first argument of each command is the collection name prefixed by the database name.
- The second argument is the lower inclusive bound of the range.
- The third argument is the exclusive upper bound of the range.
- In this example, we are directing all records from containers with keys of 100–199 to be part of this shard. The final argument is the tag of the shard created in Step 6.
- PM_AUDIT.AUDIT_MSG is optional. See Audit_Msg information above.
Note: It is important to make sure the keys of all containers in the system (including Policy Manager containers) are covered by a tag range. If not, the query routers will choose the server to store the records without guidance, and might store them on servers in a different data center entirely.
Execute the addTagRange commands for each tag, or shard, with a different range. Do not create ranges that overlap with other shard tags.
Perform the shard configuration steps for each replica set. Each replica set represents one shard cluster.
Database driver settings
When a read is performed through a query router, the default settings would have the query router route the query to each of the primary shards in the cluster. This would not be ideal, because it would cause the queries to span data centers. To avoid this, you can configure the database driver with a read preference.
The read preference is configured as a query parameter of the URI of the MongoDB connection used by a database client. Creating the URI is part of the configuration steps in the next section, Installing Network Director. The database URI and the possible settings are described in detail in the MongoDB documentation: https://docs.mongodb.org/manual/reference/connection-string/.
The readPreference setting supports a variety of options. The option we are using is the nearest option. This tells the query router to direct all reads to the closest member of a replica set, regardless of whether the member is a primary or secondary shard. For more information on the nearest read preference, see https://docs.mongodb.org/manual/reference/read-preference/#nearest.
Note: If you choose to have a secondary replica in the same data center as the primary, and then, based on this read preference, the database driver determines that the secondary replica is closer than the primary, the read is performed against the secondary replica.
An example of a MongoDB URI with this setting is shown in the example below.
monogdb://routerHost:27017/AKANA?readPreference=nearest
To be tolerant of query router outages, you can deploy multiple query routers in a data center, creating a cluster of query routers. If the primary goes down, the database driver will fail over to a different query router in the cluster. To make use of this functionality, the driver must be configured with the addresses of each of the query routers by providing a comma-separated list of host:port values in the MongoDB URI. An example is shown below.
monogdb://routerHost1:27017,routerHost2:27017,routerHost3:27017/AKANA
There are several other options for the database driver that can be set using the MongoDB URI. For a full list of options, review the MongoDB reference manual at https://docs.mongodb.org/manual/reference/connection-string/. For convenience, some of the more commonly used settings are listed below.
- connectTimeoutMS—The time, in milliseconds, to attempt a connection before timing out. The default is never to timeout, though different drivers might vary.
- socketTimeoutMS—The time, in milliseconds, to attempt a send or receive on a socket before the attempt times out. The default is never to timeout, though different drivers might vary.
- maxPoolSize—The maximum number of connections in the connection pool. Default: 100.
- minPoolSize—The minimum number of connections in the connection pool. Default: 0.
- waitQueueMultiple—A number that the driver multiplies the maxPoolSize value to, to provide the maximum number of threads allowed to wait for a connection to become available from the pool.
- waitQueueTimeoutMS—The maximum time, in milliseconds, that a thread can wait for a connection to become available.
An example of using these options is shown below.
monogdb://routerHost1:27017/AKANA?connectTimeoutMS=15000&socketTimeoutMS=1500000&maxPoolSize=100&waitQueueMultiple=5&waitQueueTimeoutMS=10000
Troubleshooting
The following sections outline steps to help diagnose problems with the data store configuration:
- Verify shard configuration
- Verify proper data distribution across shards
- Check MongoDB process logs
- Flush a query router's configuration
- Error: Did not find local voted for document at startup
Verify shard configuration
Step 1: Connect to the admin shell of the local query router, as shown in the example below.
mongo hostA:27018/admin
Step 2: From the shell, change the current database to the config database, as shown in the example below.
> use config
Step 3: Print a formatted report of the sharding configuration and the information regarding existing chunks in a sharded cluster, as shown in the example below.
> sh.status()
If the total number of chunks is greater than or equal to 20, the default behavior suppresses the detailed chunk information. For more information about this command and its output, see https://docs.mongodb.org/v3.0/reference/method/sh.status/.
Step 4: Verify that the shards have the correct hosts and ports.
Step 5: Verify that the shards are associated with the correct replica sets.
Step 6: Verify that the database is sharded.
Step 7: Verify the shard key is correct.
Step 8: Verify that the tags are split amongst the shards correctly.
Verify proper data distribution across shards
Step 1: Connect to the admin shell of the local query router, as shown in the example below.
mongo hostA:27018/admin
Step 2: From the shell, change the current database to the database that you want to verify, as shown in the example below.
> use METRIC_ROLLUP_DATA
Step 3: Print the data distribution statistics for the sharded collection to verify, as shown in the example below.
> db.OPERATIONAL_METRIC.getShardDistribution()
For more information about this command and its output, see https://docs.mongodb.com/v3.0/reference/method/db.collection.getShardDistribution/.
Step 4: Verify that the statistics for each of the shards match with your expectations based on the data being stored.
Check MongoDB process logs
By default, each MongoDB process (query router, configuration server, database server, and arbiter) writes diagnostic and error information to the shell it was started from. Each process can be configured to write this information to a log file instead.
To instruct a process to write to a log, add a systemLog section in its configuration file, as shown in the example below.
01) systemLog:
02)     path: /logs/shardA
In the above:
- Line 01 starts the systemLog section.
- Line 02 provides a location to which log files will be written.
There are several other options for logging, described in detail at https://docs.mongodb.org/manual/reference/configuration-options/.
Flush a query router's configuration
If there is a concern that a query router is using stale information because its cache is out of date, you can flush the cache and force the query router to re-read the config database. To flush a query router's cache, perform the following steps.
Step 1: Connect to the admin shell of the query router, as shown in the example below.
mongo hostA:27018/admin
Step 2: From the shell, flush the cache, as shown in the example below.
> db.adminCommand("flushRouterConfig")
Error: Did not find local voted for document at startup
In certain instances, on starting up the configuration server you might encounter the following error:

Did not find local voted for document at startup.
Did not find local replica set configuration document at startup. Did not find replica set configuration document in local.system.replset
If you encounter this error, connect to the configuration database and do an rs.initiate(). An example is shown below.
rs.initiate(
  {
    _id: "<replica set name>",
    configsvr: true,
    members: [
      { _id : 0, host : "<hostA>:27019" },
      { _id : 1, host : "<hostB>:27019" },
      { _id : 2, host : "<hostC>:27019" }
    ]
  }
)
In the above, <replica set name> is the name of the replica set passed into the mongod --replSet parameter when starting the configuration database servers.
For more information, refer to the MongoDB documentation: https://docs.mongodb.com/manual/tutorial/deploy-shard-cluster/#initiate-the-replica-set.
API Gateway installation and configuration
This section covers:
- A walk through of the steps for installing and configuring the Policy Manager and Network Director processes in two different data centers.
- Designating one data center as the primary data center and the other as the secondary data center to denote the location of the primary relational database.
Basic installation steps are omitted, because they are in the standard installation instructions for the product. See:
This section includes:
Primary data center
The primary data center is home to the primary relational database, which is the only database instance that can support writes. The following subsections outline the steps for setting up the primary data center. The processes include:
- Installing Policy Manager
- Creating a Policy Manager cluster
- Creating a listener for the cluster container
- Hosting Policy Manager services on the cluster
- Adding Policy Manager container to the cluster
- Installing Network Director
Installing Policy Manager
First, as in a typical installation, we will install a container with the Policy Manager Console and Subsystems features. Because we are going to use MongoDB for reading and writing data generated by the Network Director, we must perform an additional step of configuring this container to use MongoDB.
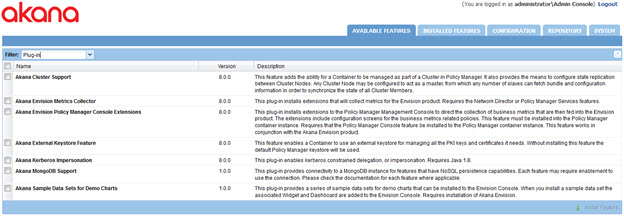
To configure any Akana container to communicate with MongoDB, you must install the Akana MongoDB Support plugin. You can find the plugin on the Available Features page of the Akana Administration Console using the Plug-in filter.
This plugin has only one configuration setting; the URI of the MongoDB database. This URI includes the host and port of the database server as well as the database name in the path. By default, the name of the database installed for all Akana products is AKANA.
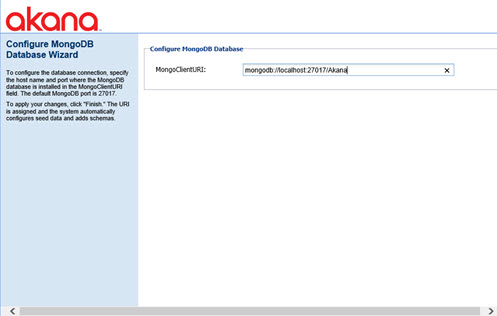
In this deployment, we will use the URI to the MongoDB query router installed in the local data center as outlined in Database driver settings. At the conclusion of this configuration, after restarting, we will have a Policy Manager process that can write to the primary relational database and read/write from the local MongoDB server farm through the query router.
Creating a Policy Manager cluster
Ultimately we will have Network Directors in different data centers that communicate only with locally installed Policy Manager containers. As part of setting this up, we need to create Policy Manager clusters in each data center so that the Policy Manager containers can be separated from the perspective of the Network Directors.
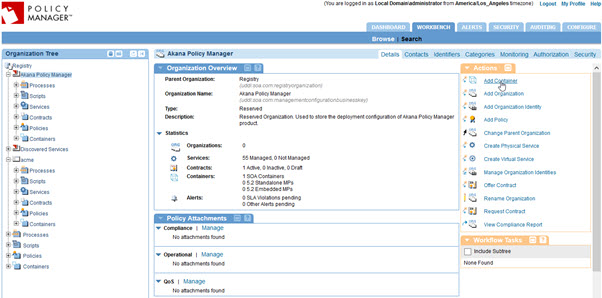
- From the Policy Manager Management Console, navigate to the Akana Policy Manager organization.
- Click Add Container, as shown below. The Add Container wizard starts.
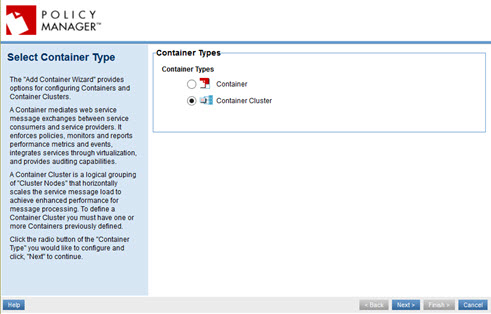
- On the first page of the wizard, select Container Cluster and then click Next.
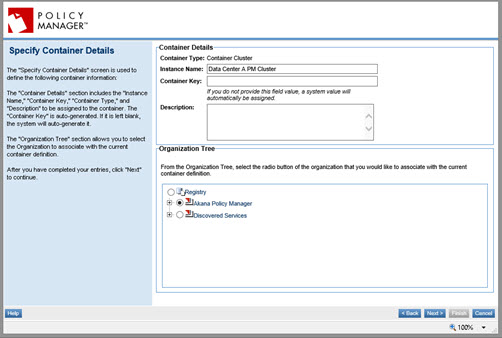
- On the Specify Container Details page, provide the name of the PM cluster for this data center, and an optional key and description, and then click Next.
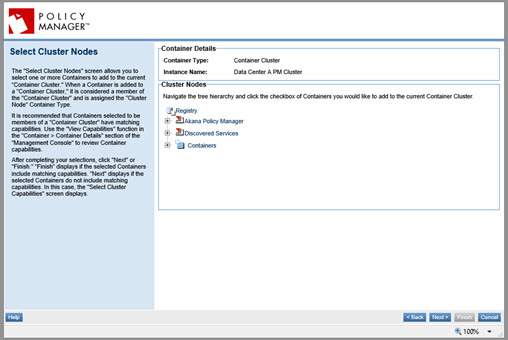
- At the Select Cluster Nodes page, do not select a container to add to the cluster at this time. Just click Next.
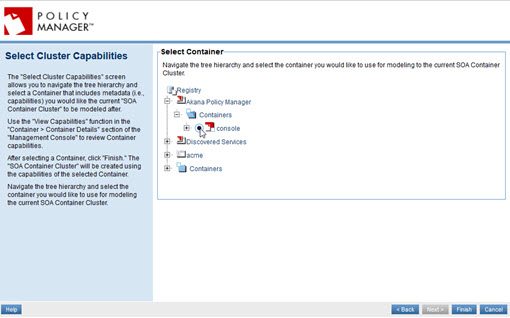
- The Select Cluster Capabilities page, the last page of the wizard, prompts you to select a container that has the capabilities you want the cluster to have. Select the Policy Manager container that you just installed and configured, and click Finish.
Creating a listener for the cluster container
The next step is to create a listener for the cluster container. This listener is the address that the local Network Directors will use to access the Policy Manager containers. There are two scenarios:
- If only one Policy Manager container is installed in the data center, you can just copy the listener information for the Policy Manager container.
- If more than one Policy Manager container is used, a load balancer should be used between the Network Directors and the Policy Managers. Then, you can model the load balancer's interface for the cluster's listener.
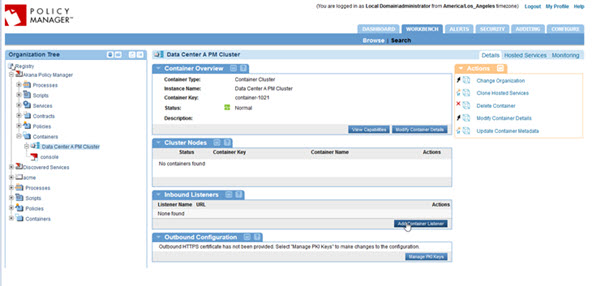
To create a listener, click the Add Container Listener button in the Inbound Listeners portlet, as shown below. This starts the Add Container Listener wizard.
This document does not include details for all the pages of the Add Container Listener wizard. However, very importantly:
- For the cluster listener, make sure you use the same name as the listener of the Policy Manager container that is in the cluster. If there are multiple Policy Manager containers in the cluster, they MUST all share the same listener names.
Hosting Policy Manager services on the cluster
The next step is to host all the Policy Manager services on the cluster.
- Select the original Policy Manager container in the tree. Then, on the right, click Clone Hosted Services. The Clone Hosted Services wizard starts.
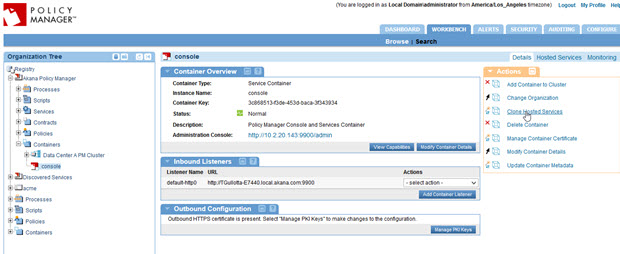
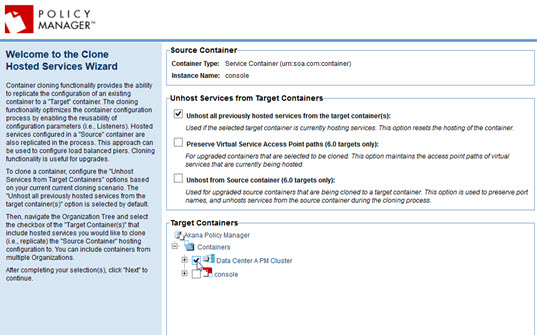
- On the first page, select the cluster as the target container and then click Next.
- At the confirmation page, click Finish.
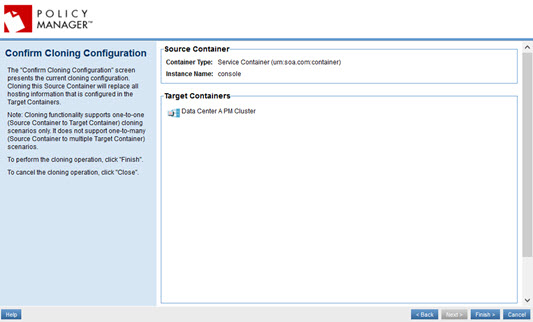
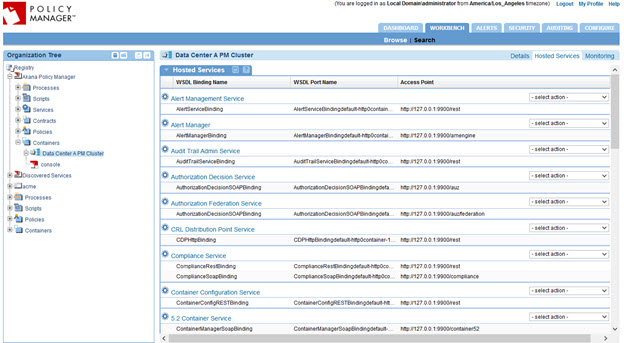
At this point, you should be able to select the cluster in the tree, and the Hosted Services tab, and see all the Policy Manager services listed.
Adding Policy Manager container to the cluster
The last step in creating the cluster is to place the original Policy Manager container in the cluster.
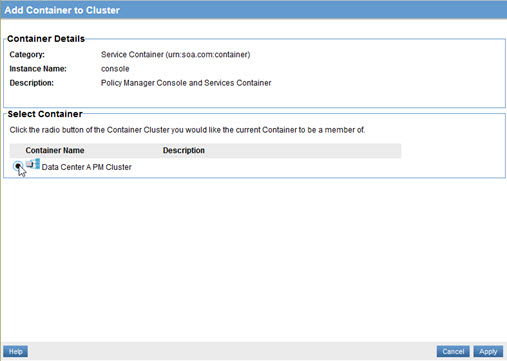
- Select the original container and, on the right, click Add Container to Cluster, as shown below.
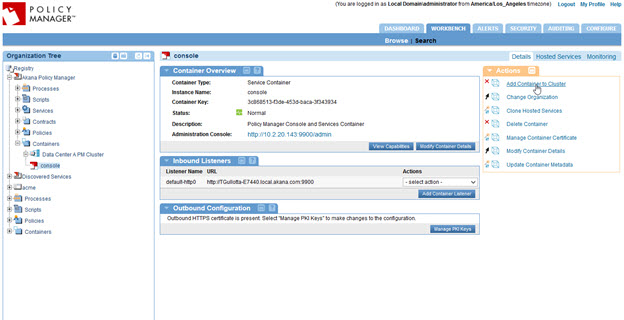
- At the Add Container to Cluster page, select the cluster and click Apply.
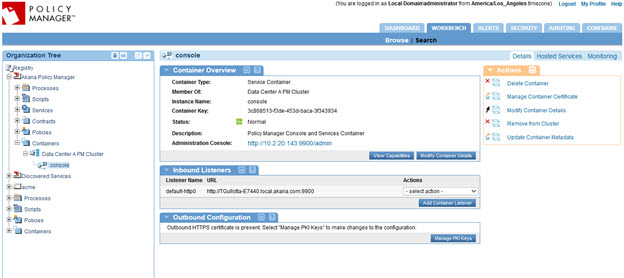
Now, you have a fully configured Policy Manager cluster with the first Policy Manager container as a cluster node, as shown below.
Follow the previous steps for additional Policy Manager containers to provide increased scale or fault tolerance.
Installing Network Director
The next step is to install and configure a Network Director.
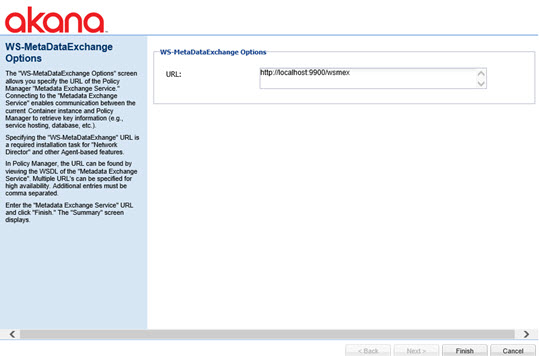
- Follow all the typical steps for installing and configuring a Network Director process. On the page for providing the WS-MetadataExchange Options, enter the URL of the Policy Manager cluster set up in the previous section, as shown in the example below.
- If you want all metrics and usage log information to be written from the Network Director to the Policy Manager process over a secure link, use the Akana Administration Console for the Network Director container to modify database access settings, as shown below. In the com.soa.monitor.usage configuration category:
- Turn off direct database access: set the usage.local.writer.enabled option to false.
- Turn on remote Policy Manager access: set the usage.remote.writer.enabled option to true.
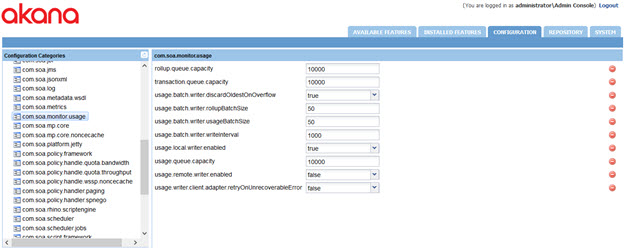
If you want the data to be written directly to the local primary MongoDB shard instead, leave that option set to false. However, for this to work, you must also install the same Akana MongoDB Support plugin on the Network Director container. The URI of the query router should also be used for the Network Director to shield the Network Director from possible MongoDB configuration changes down the line.
- Follow the previous steps for additional Network Director containers to provide increased scale or fault tolerance.
Secondary data center
The installation and configuration of the containers in the secondary data center is very similar to the primary data center. All of the steps in the Primary Data Center section apply, with two differences:
- The connection is to the local secondary RDBMS and local MongoDB query router.
- There is a difference in how the services of the secondary Policy Manager are provisioned, outlined below.
This section includes:
- Policy Manager Provisioning
- To register the secondary Policy Manager
- Creating a cluster for the secondary database
Policy Manager Provisioning
When configuring the Policy Manager Services feature in the Akana Administration Console, do not configure an administrator name and password or select the option to Provision Services. Both of these actions require writing to the relational database, and since this container is configured to use a secondary database the actions will not work. The administrator name and password have already been set up when configuring the primary data center. Service provisioning is done a different way, as described below. When the configuration wizard is complete, restart the container.
Register the secondary Policy Manager container with the system as we would for a Network Director.
To register the secondary Policy Manager
- Log in to the primary data center's Policy Manager Management Console and navigate to the Akana Policy Manager organization.
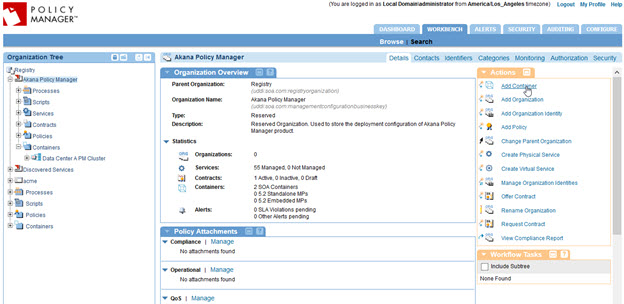
- Click Add Container, as shown below. The Add Container wizard opens.
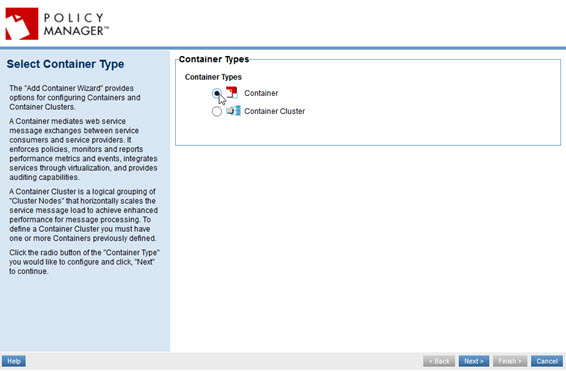
- At the Select Container Type page, select Container (the default) and click Next.
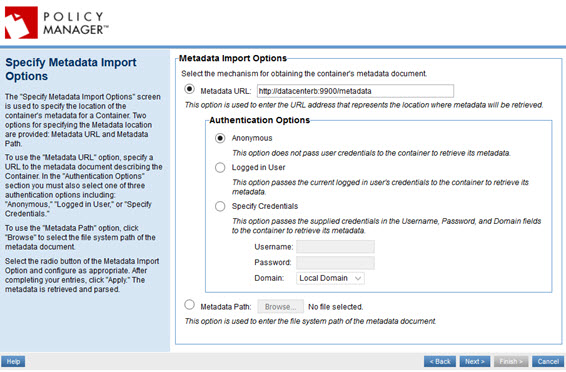
- On the Specify Metadata Import Options page, enter the metadata address of the secondary Policy Manager container (<scheme>://<host>:<port>/metadata), as shown below.
- Complete the wizard, adding any trusted certificates if prompted.
At this point, we now have the new Policy Manager container in the organization tree.
Creating a cluster for the secondary database
- Next we will create a cluster for the secondary database following procedures similar to those used in the primary data center. When choosing a container whose capabilities we want to model in the cluster, choose the secondary PM container.
- At this point, we want to clone the services to be hosted by cluster.
- When doing this with the primary data center we choose the primary PM container to clone services from.
- In the secondary case, the secondary PM container does not have any services to clone yet. Instead, we will clone services from the Data Center A PM Cluster to the Data Center B PM Cluster.
- Remember that the listener names between the two clusters must match in order for the cloning to work properly.
- Now that we have a secondary PM cluster with hosted services, we can now move the secondary PM container into the secondary PM cluster, as shown below. Once the container is moved into the cluster, the services from the cluster is provisioned for the PM container.
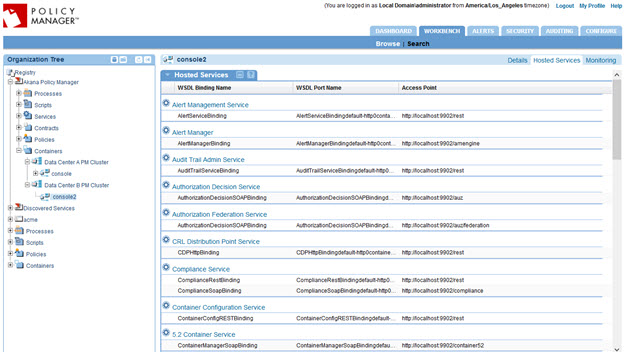
- This performs the same step as the provisioning configuration task in the Akana Administration Console. It records the services the container is hosting in the database.
- At this point, restart the secondary PM container so that it will start listening for messages for those services.
- The secondary PM container is now fully functional in a read-only manner, providing all necessary services for the local Network Directors to use.
- Follow the previous steps for additional secondary Policy Manager containers to provide increased scale or fault tolerance.
Sample configuration file
The sample file below is the sample sharding script for all the collections that are sharded, in a working installation with two data centers. In this example, sharding is based on the container keys. The container keys are assigned as numbers instead of UUID and are then used as tag ranges.
use PM
db.ALERTS.createIndex(
	{ 	"containerKey" : 1,
		"_id" : 1
	},
	{"name" : "containerKey_1__id_1", background : true}
);
use PM_AUDIT
db.AUDIT.createIndex(
                {
                        "containerKey" : 1,
                        "eventId" : 1
                },
                {"name" : "containerKey_1_eventId_1", background : true}
				);

use METRIC_RAW_DATA
db.OPERATIONAL_METRIC.createIndex(
                {
                        "containerKey" : 1,
                        "_id" : 1
                },
                {"name" : "containerKey_1__id_1", background : true}
				);
use METRIC_ROLLUP_DATA
db.OPERATIONAL_METRIC.createIndex(
                {
                        "containerKey" : 1,
                        "_id" : 1
                },
                {"name" : "containerKey_direct_1__id_1", background : true}
				);

use admin
sh.addShardTag("DCWest", "DCWest")
sh.addShardTag("DCEast", "DCEast")
sh.enableSharding("PM")
sh.enableSharding("PM_AUDIT")
sh.enableSharding("METRIC_RAW_DATA")
sh.enableSharding("METRIC_ROLLUP_DATA")
use PM
sh.shardCollection("PM.ALERTS",
{"containerKey":1, _id: 1}
)
use PM_AUDIT
sh.shardCollection("PM_AUDIT.AUDIT",
{"containerKey":1, eventId: 1}
)
use METRIC_RAW_DATA
sh.shardCollection("METRIC_RAW_DATA.OPERATIONAL_METRIC",
{"containerKey":1, _id: 1}
)
use METRIC_ROLLUP_DATA
sh.shardCollection("METRIC_ROLLUP_DATA.OPERATIONAL_METRIC",
{"containerKey":1, _id: 1}
)
sh.addTagRange("PM.ALERTS",{ "containerKey": "$minKey"},{ "containerKey": "5000000"}, "DCWest")
sh.addTagRange("PM_AUDIT.AUDIT",{ "containerKey": "$minKey"},{ "containerKey": "5000000"}, "DCWest")
sh.addTagRange("METRIC_RAW_DATA.OPERATIONAL_METRIC",{ "containerKey": "$minKey"},{ "containerKey": "5000000"}, "DCWest")
sh.addTagRange("METRIC_ROLLUP_DATA.OPERATIONAL_METRIC", { "_id" : { "containerKey": "$minKey"}},{ "_id" :{ "containerKey": "5000000" }}, "DCWest")
sh.addTagRange("PM.ALERT_AUDIT_TRAIL", { "containerKey": "$minKey"},{ "containerKey": "5000000"}, "DCWest")
sh.addTagRange("PM.CONTAINER_STATE", { "containerKey": "$minKey"},{ "containerKey": "5000000"}, "DCWest")
sh.addTagRange("PM.SECURITY_AUDIT_TRAIL", { "containerKey": "$minKey"},{ "containerKey": "5000000"}, "DCWest")
sh.addTagRange("PM_AUDIT.AUDIT_TRANSACTION_METRIC", { "containerKey": "$minKey"},{ "containerKey": "5000000"}, "DCWest")

-- DCEast
sh.addTagRange("PM.ALERTS",{ "containerKey": "5000000"},{ "containerKey": "6000000"}, "DCEast")
sh.addTagRange("PM_AUDIT.AUDIT",{ "containerKey": "5000000"},{ "containerKey": "6000000"}, "DCEast")
sh.addTagRange("METRIC_RAW_DATA.OPERATIONAL_METRIC",{ "containerKey": "5000000"},{ "containerKey": "6000000"}, "DCEast")
sh.addTagRange("METRIC_ROLLUP_DATA.OPERATIONAL_METRIC", { "_id" : { "containerKey": "5000000"}},{ "_id" :{ "containerKey": "6000000" }}, "DCEast")
sh.addTagRange("PM.ALERT_AUDIT_TRAIL", { "containerKey": "5000000"},{ "containerKey": "6000000"}, "DCEast")
sh.addTagRange("PM.CONTAINER_STATE", { "containerKey": "5000000"},{ "containerKey": "6000000"}, "DCEast")
sh.addTagRange("PM.SECURITY_AUDIT_TRAIL", { "containerKey": "5000000"},{ "containerKey": "6000000"}, "DCEast")
sh.addTagRange("PM_AUDIT.AUDIT_TRANSACTION_METRIC", { "containerKey": "5000000"},{ "containerKey": "6000000"}, "DCEast")
