Elasticsearch Log Plug-In (versions prior to 2020.2.16)
Learn how to install and use the Akana Elasticsearch Log Plug-In to write log files to the Elasticsearch server.
Table of Contents
- Overview
- Installation
- Configuring properties to save container logs to Elasticsearch (com.soa.log)
- Logged Data: container logs
- Configuring properties to save HTTP access logs to Elasticsearch (com.akana.log.elasticsearch)
- Logged Data: HTTP access logs
Overview
The Akana Elasticsearch Log Plug-In can be installed on each of the Akana containers. This plug-in allows Akana container exception data, and optionally access log information, into Elasticsearch.
You can use Kibana to view the data pushed into Elasticsearch, or query it directly. The data is returned as a JSON document.
There are two sets of configuration properties that you can use to configure the Elasticsearch Log Plug-In to write data to Elasticsearch rather than the default location.
-
com.soa.log: Allows you to configure the platform to write the container logs to the Elasticsearch server.
-
com.akana.log.elasticsearch: Allows you to configure the platform to write the HTTP access logs (or HTTP request logs) to the Elasticsearch server.
Installation
The Akana Elasticsearch Log Plug-In is a part of the Akana Option packs and is downloaded from the Support Download site. It can be installed in any of the Akana containers.
To download: Go to the Rogue Wave Support Center (https://library.roguewave.com). Click Product Downloads > Akana - Product Downloads > choose version. Option packs are in the bottom section of the page. Download the version number that matches your installation.
Unzip the file, and then copy everything contained inside the /lib/ folder in the ZIP file (folders and files), to the /lib/ folder of your installation. For example: \lib\optionpacks\2019.1.3.
You can then install the feature using the Akana Administration Console.
Any container where the Akana Elasticsearch Log Plug-In is installed, must be able to access the Elasticsearch server.
Configuring properties to save container logs to Elasticsearch (com.soa.log)
After installing the plug-in, you can configure the container so that, instead of writing the server logs to the disk, it writes them to the Elasticsearch server.
In the Akana Administration Console, go to Configuration > Configuration Categories > com.soa.log and configure the properties indicated in the boxes below.
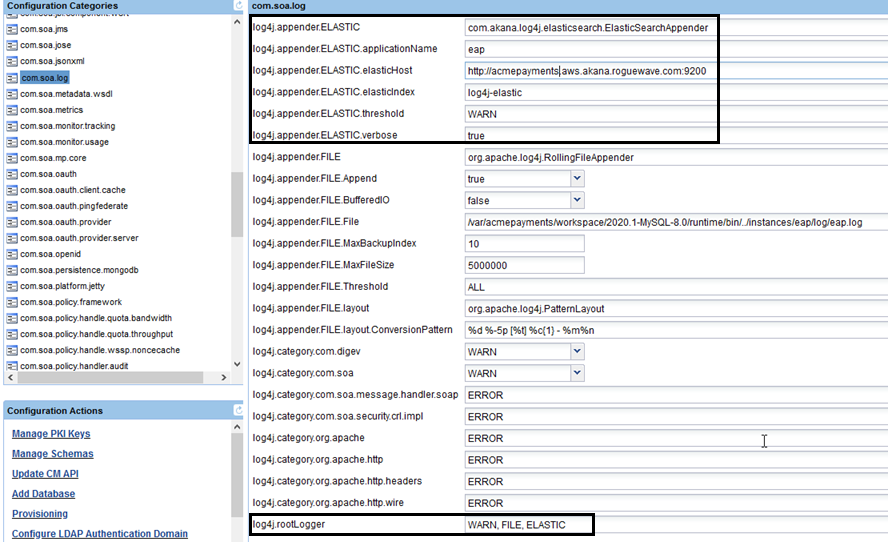
Properties that are required are shown in the table below.
| Property | Description |
|---|---|
| log4j.appender.ELASTIC | The value is always com.akana.log4j.elasticsearch.ElasticSearchAppender. Do not change it. |
| log4j.appender.ELASTIC.applicationName | The name of the application: For example ND, PM, CM, Quartz, OAuth. |
| log4j.appender.ELASTIC.elasticHost | Fully-qualified URL for the Elasticsearch server: for example, http(s)://{es_host}:{es_port} |
| log4j.appender.ELASTIC.elasticIndex |
The Elasticsearch index where the data will be stored. Default: log4j-elastic-${year}-${month} |
| log4j.appender.ELASTIC.threshold |
Threshold setting. Default: TRACE. Valid values: ERROR, WARN, INFO. Note: Setting below WARN could result in recursive logging. |
| log4j.appender.ELASTIC.verbose |
With verbose set to false, only error information is stored in Elasticsearch. When set to true, the whole log message is stored: potentially useful for debugging, but with increased load in terms of processing and storage. There is also the possibility of sensitive information in the messages, which could be a security risk. Default: false |
| log4j.rootLogger | Add ELASTIC as the last entry on the list. For example: ERROR, FILE, ELASTIC |
Logged Data: container logs
This plug-in pushes the exceptions from the access request log file into Elasticsearch. An example message is shown below. This 404 exception is logged in Elasticsearch. For additional information regarding this error (for example, what may have caused the error, exception) the container log files residing on the file system are still required, because this information is not pushed into Elasticsearch.
{
  "_index": "request-log",
  "_type": "_doc",
  "_id": "ecd1436d-6552-431b-a79e-07082646bac7",
  "_version": 1,
  "_score": null,
  "_source": {
    "@timestamp": "2020-02-24T23:55:35.524Z",
    "hostName": "ap-ex-swest",
    "applicationName": "AP",
    "containerKey": "1000105",
    "instanceName": "ap-ex-swest",
    "logger": "com.soa.transport.jetty.JettyTransportBinding",
    "level": "ERROR",
    "className": "com.soa.transport.http.HttpException",
    "message": "HTTP Error [404:Not Found] when accessing the URI [Not specified]",
    "stackTrace": "com.soa.transport.http.HttpException: HTTP Error [404:Not Found] when. . . . [abbreviated for display purposes] \n\tat java.util.concurrent.ThreadPoolExecutor$Worker.run(ThreadPoolExecutor.java:624)\n\tat java.lang.Thread.run(Thread.java:748)\n\n\t",
    "request": null,
    "tenant": "none",
    "eventId": "264c24d7-5761-11ea-9044-b5a9b2cef593",
    "alertCode": 9022
  },
  "fields": {
    "@timestamp": [
      "2020-02-24T23:55:35.524Z"
    ]
  },
  "sort": [
    1582588535524
  ]
}
Configuring properties to save HTTP access logs to Elasticsearch (com.akana.log.elasticsearch)
After the plug-in is installed, the following configuration category is added to the container and the following properties configured.
The configuration PID is: com.akana.log.elasticsearch
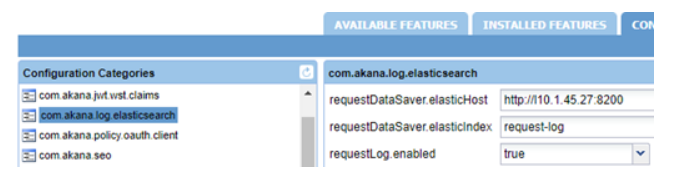
Properties that are required are shown in the table below.
| Property | Description |
|---|---|
| requestDataSaver.elasticHost |
The Elasticsearch server host and port url: http(s)://{es_host}:{es_port}. Default: http://localhost:9200. |
| requestDataSaver.elasticIndex |
The Elasticsearch index to store the data. Default: request-log. |
| requestLog.enabled |
To enable the logging, set to true. False disables the logging. Default: false. |
Logged Data: HTTP access logs
This plug-in pushes the exceptions from the HTTP access request log file into Elasticsearch. An example log entry is shown below.
{
  "_index":"request-log",
  "_type":"_doc",
  "_id":"GREqUnMBasfBiMra4uPq",
  "_score":1.0,
  "_source":{
    "@timestamp":"2020-07-15T11:10:09.127Z",
    "hostName":"3TNT8P4",
    "containerKey":"6ff2-409f-4a2d-974d-664c6b4b7a99",
    "instanceName":"eapNd",
    "apache2":{
      "access":{
        "method":"GET",
        "http_version":"1.1",
        "vhost":"gw.aka.na",
        "secure":false,
        "url":"http://gw.aka.na:7905/admin/config/",
        "request_type":"application/json",
        "request_size":-1,
        "remote_ip":"10.250.24.223",
        "remote_port":45920,
        "local_ip":"10.250.25.249",
        "local_port":7905,
        "user_name":"",
        "referrer":null,
        "user_agent_header":"okhttp/4.2.1",
        "response_type":"application/json",
        "response_code":200,
        "access":{
          "bytes":180
        },
        "dispatch_duration":1,
        "duration":1
      }
    },
    "accept":{
      "accept":"application/json",
      "accept-encoding":"gzip"
    }
  }
}


