Monitoring the Health of a Container: Akana System Health Tool
Provides information about the Akana System Health tool and its associated API.
For information about monitoring container health when load balancing is in use, see Monitoring Container Status with Load Balancing.
On this page:
- Overview
- Checking health statistics via the System Health Tool
- What to monitor—recommendations
- System Health Tool user interface
- System Health Tool API
Overview
There are two ways to monitor container health:
- Visually through the Monitoring Tool (see Using the Admin Monitoring Tool).
With this tool, container health statistics are represented visually, but since the statistics are only available through the GUI, there is no way to use the data for operational use.
- Using the System Health Tool. See Checking Health Statistics via the System Health Tool below.
The System Health Tool is a feature of the core platform and can be leveraged by all containers, including Policy Manager, Community Manager, and Envision.
Checking health statistics via the System Health Tool
You can use the System Health tool to check system health information in two ways:
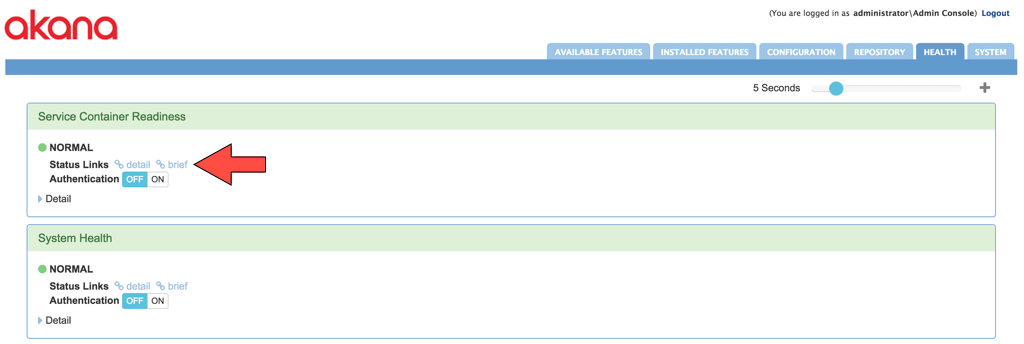
- Via the Akana Administration Console, Health tab. See System Health Tool user interface.
- By using the System Health Tool API. Using the API, you can retrieve health statistics by making a GET call to any Akana container. See System Health Tool API. An example of how you can use this is to provide a health status to load balancers, so the load balancer has information on the health of any aspect of container operation.
In addition, the System Health Tool allows thresholds to be configured for any monitored attributes, providing the means to get information on any values that fall outside normal or expected ranges. See Thresholds.
What to monitor—recommendations
A primary use case for this tool is to check the health of the container to determine if it is ready to handle traffic.
The health statistics available are the same as the Monitoring Tool, which means that any standard OSGi Monitorable instance in the system can be tracked, including but not limited to:
- Outgoing HTTP connection pool statistics
- Incoming HTTP thread pools
- Database connection pools
- Container memory usage
- Usage monitoring queues
- JMS connections
- Container configuration state
- Container lifecycle
Note: The system health statistics reflect real-time information about the container. The System Health Tool does not store this information. You can either view real-time information, or you can have an external monitoring tool call the System Health Tool so that you can store and track the data.
The table below shows some key items that it might be a good idea to monitor.
| Item | Data |
|---|---|
| com.soa.vmstats | Monitors CPU and memory at the VM level. Notes re com.soa.vmstats:
Note: For information about the com.soa.vmstats values, refer to https://docs.oracle.com/javase/8/docs/api/java/lang/management/MemoryMXBean.html (Java documentation). |
|
com.soa.db.stats: available.pool.headroom.pct OR available.pool.headroom |
For containers connecting to the database, it's a good idea to monitor com.soa.db.stats – available.pool.headroom.pct OR available.pool.headroom. This shows how many connections are being used by the database. If it gets too high, potentially the container will run out of database connections in the pool, and errors might start occurring. |
|
akana.health.lifecycle: lifecycle.state |
Indicates that the container is STARTED (or not). |
|
com.soa.container.config.config.stats: configuration.state |
Make sure that the state is CONFIGURED. |
|
com.soa.transport.http.client: pool.headroom OR pool.headroom.pct |
This indicates the available connections in the pool for outbound HTTP traffic from the container. For a Network Director container, this generally means connections to Policy Manager and connections to the backend service. For PM/CM, it is still for outbound HTTP traffic but less of a concern. In either case, if the available space is starting to reach its max the container potentially might not have connections available to make any outbound HTTP traffic. |
|
soa.jetty.connector: connections.open OR connections.open.max |
Indicates the connections being used for each inbound listener on the container. If the connections are near the maximum configured number, there might not be connections available for inbound traffic. |
System Health Tool user interface
All containers have the System Health Tool installed when any of the PM, CM, or ND features are installed. No additional configuration is required.
You can explore this feature through the Health tab in the Akana Administration Console.
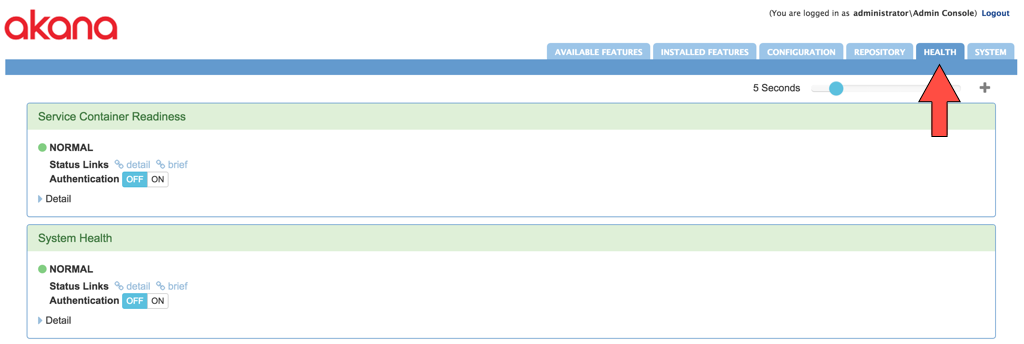
Some features of this tool in the user interface:
Additionally, you can:
- Edit standard panels
- Add a new subpanel with metric attributes to a standard panel
- Add a new metric attribute to an existing subpanel
- Add a custom panel with metric attributes
Panels
A panel is a grouping of various types of system health information. Each panel can have any combination of types of system health information that you want to monitor.
Depending on the features installed, the Health tab will include a number of pre-configured panels. You can expand them to view detailed monitoring information.
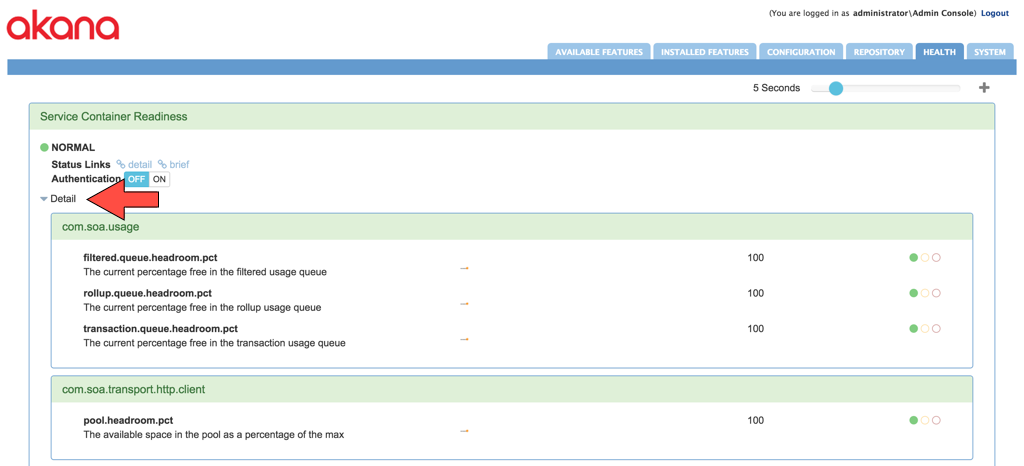
In the above, values for the com.soa.usage category:
- filtered.queue.headroom.pct
- Contains the request/response part of items in the usage log.
- rollup.queue.headroom.pct
- Contains rollup items.
- transaction.queue.headroom.pct
- Contains WS-audit transaction usage items.
You can also add a new subpanel. See Custom subpanel.
Settings
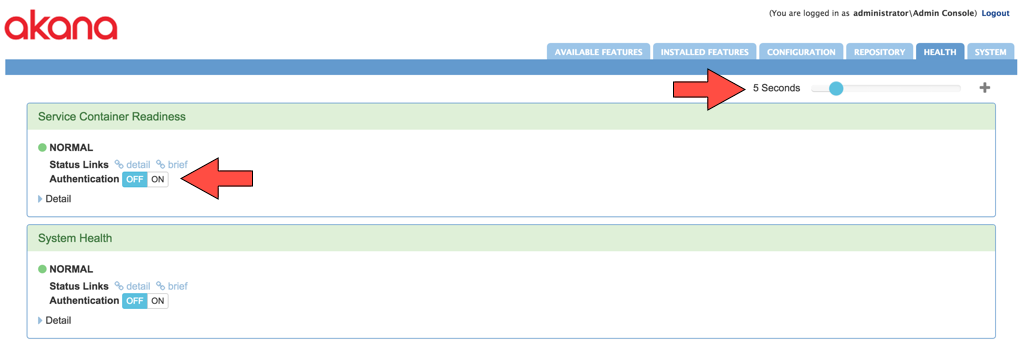
The slider in the top right corner allows you to change the frequency of the polling interval. In addition, each panel has a toggle to enable or disable authentication when accessing the System Health Tool API (see System Health Tool API).
Thresholds
Each health monitor has configurable threshold settings. These settings are used to indicate current health status using three values:
- NORMAL—Default: value ge 20
- WARNING—Default: (value lt 20) and (value ge 5)
- FAILURE—Default: value lt 5
To view or modify the default values for the threshold ranges, go to the Akana Administration Console and click the status icon.
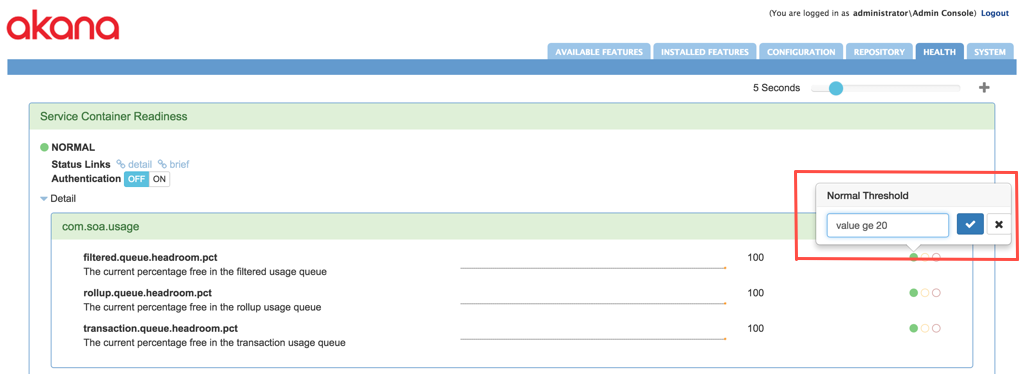
Thresholds are defined using the Apache Java Expression Language syntax. For more information, refer to the JEXL overview on the Apache Commons site. Currently, only a single variable named value is accessible, which is the current value of the monitored property.
Custom subpanel
To display a custom set of system health statistics, you can create your own subpanel. To create a new subpanel, click the plus icon. Once the panel has been created, you can then add your own combination of health monitors.
The following sample custom subpanel is configured on the Policy Manager container and is called Health Monitoring for ACME. The failure threshold is set to anything below the currently provisioned number of PM APIs.
The following threshold defines a normal condition where there is greater than 20% of capacity remaining in the pool.

The following threshold defines a warning condition where between 20% and 5% of capacity remains in the pool.

The following threshold defines a failure condition when less than 5% of capacity remains in the pool.

To check the status, simply follow the links provided, which in this case might be:
http://acme.akana.com:9900/admin/health/measurables/health.monitoring.for.acme
Edit standard panels
Standard panels provide predefined Service Container Readiness and System Health panels for monitoring the container health. These panels are editable, allowing the ability to modify or adjust the health checks directly through the standard panel.

Add a new subpanel with metric attributes to a standard panel
To add a new subpanel, click the plus (+) icon. The Select Variables window opens, where you can select the variables and add them to the standard panel.
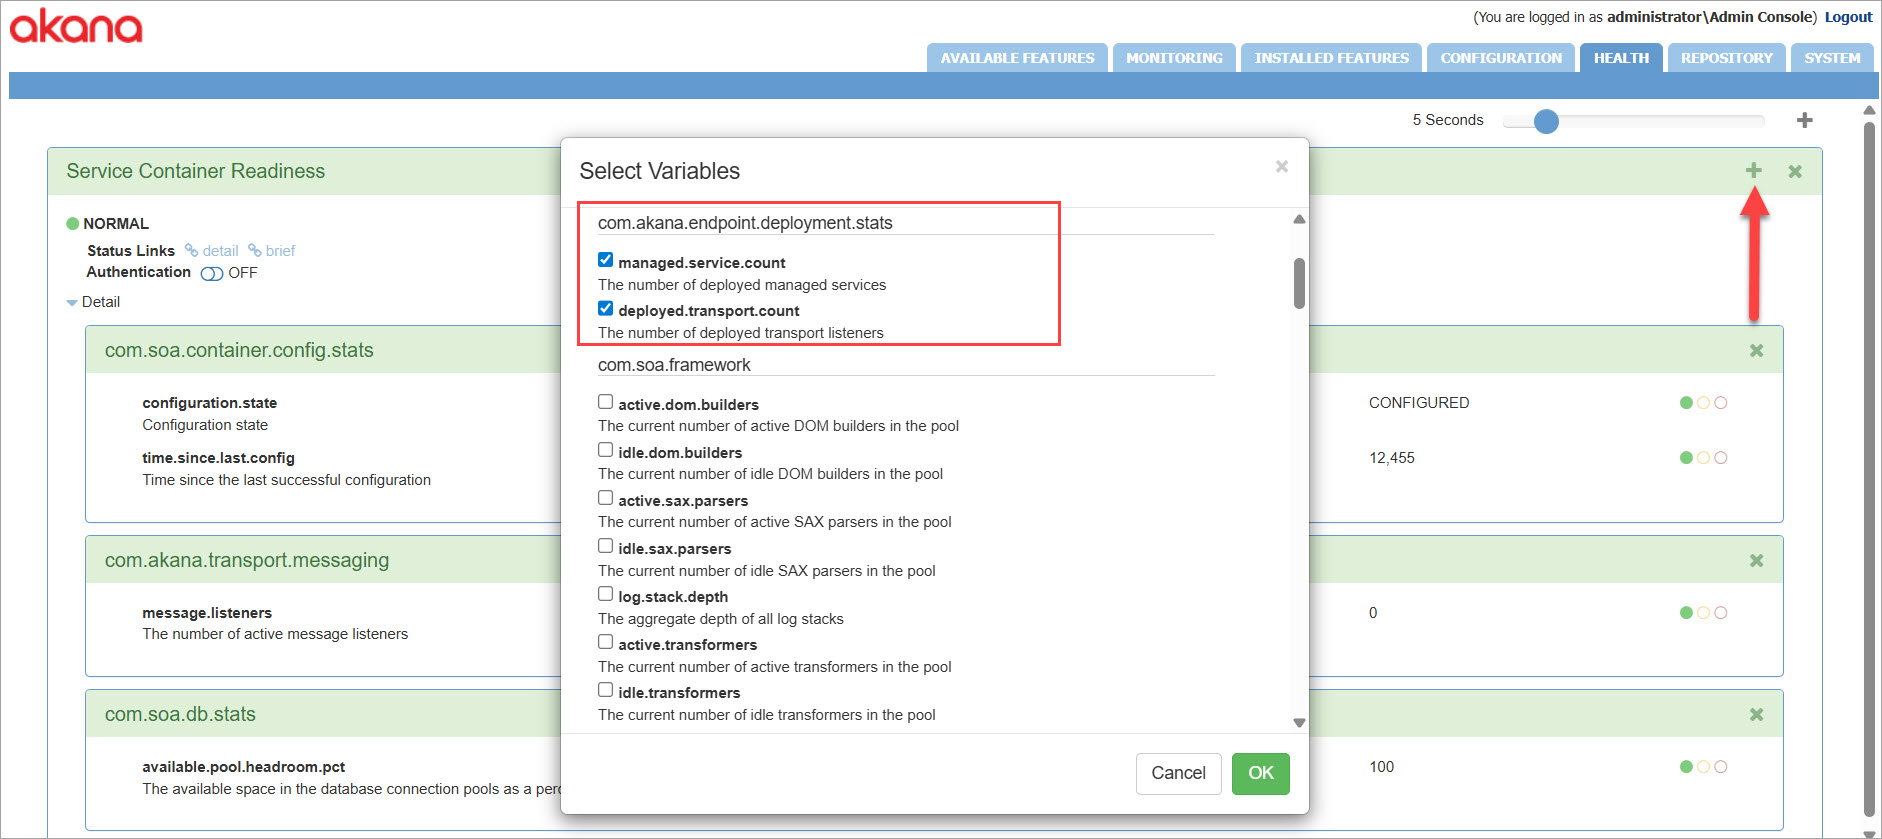
For example, under the Service Container Readiness standard panel, a new subpanel named com.akana.endpoint.deployment.stats is added. This sub-panel includes the variables managed.service.count and deployed.transport.count.
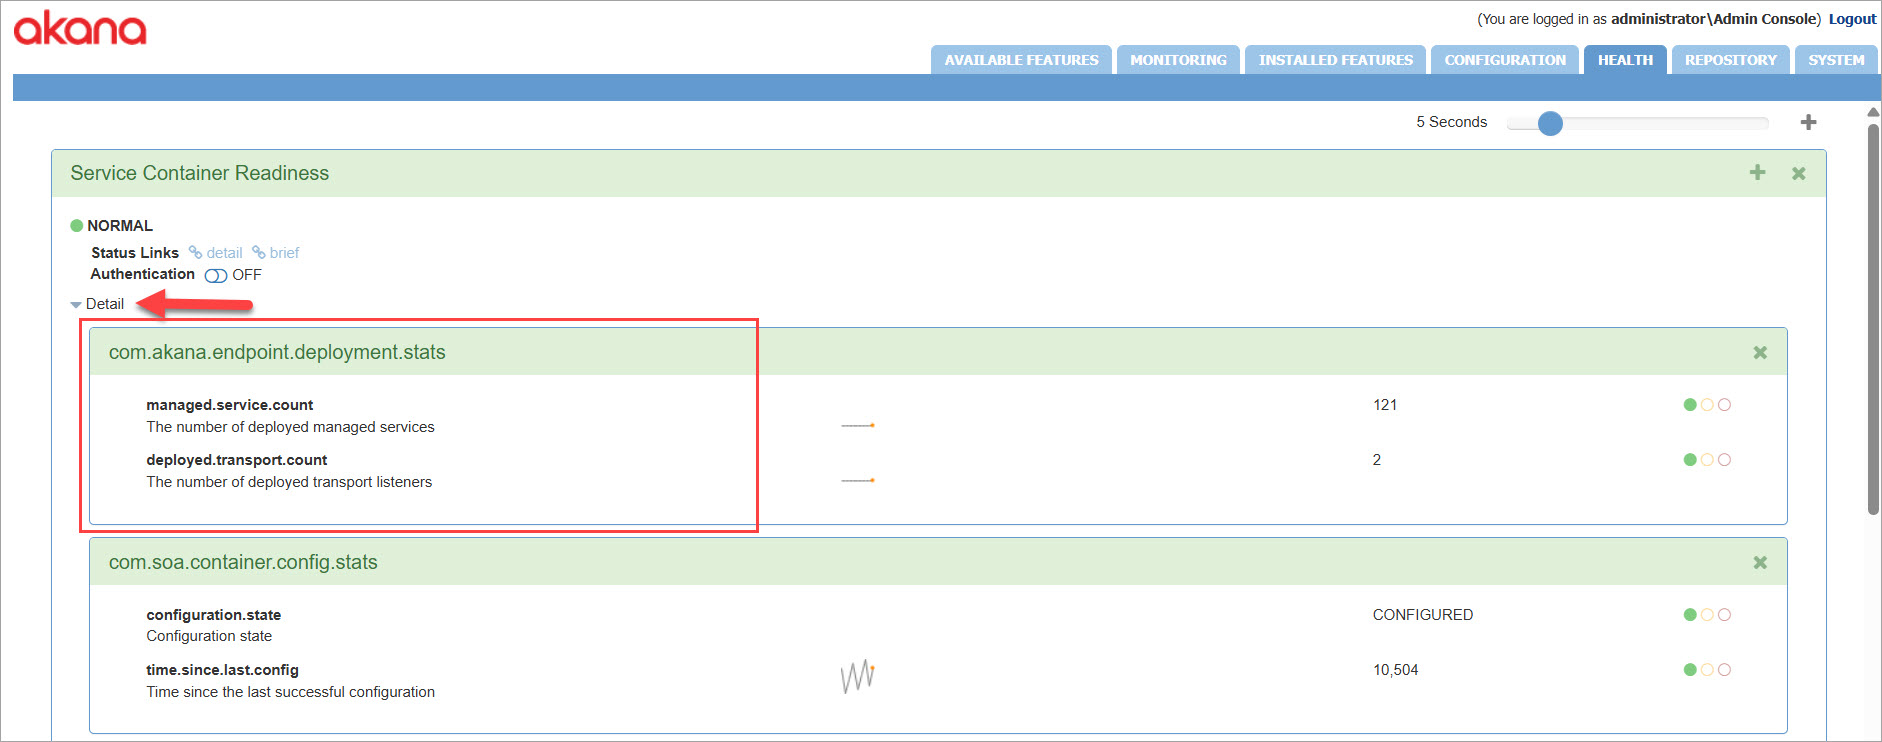
You can also configure threshold settings—Normal, Warning, or Failure to monitor health status. See Thresholds.
Add a new metric attribute to an existing subpanel
To add a new metric attribute, click the plus (+) icon, which opens the Select Variables window.
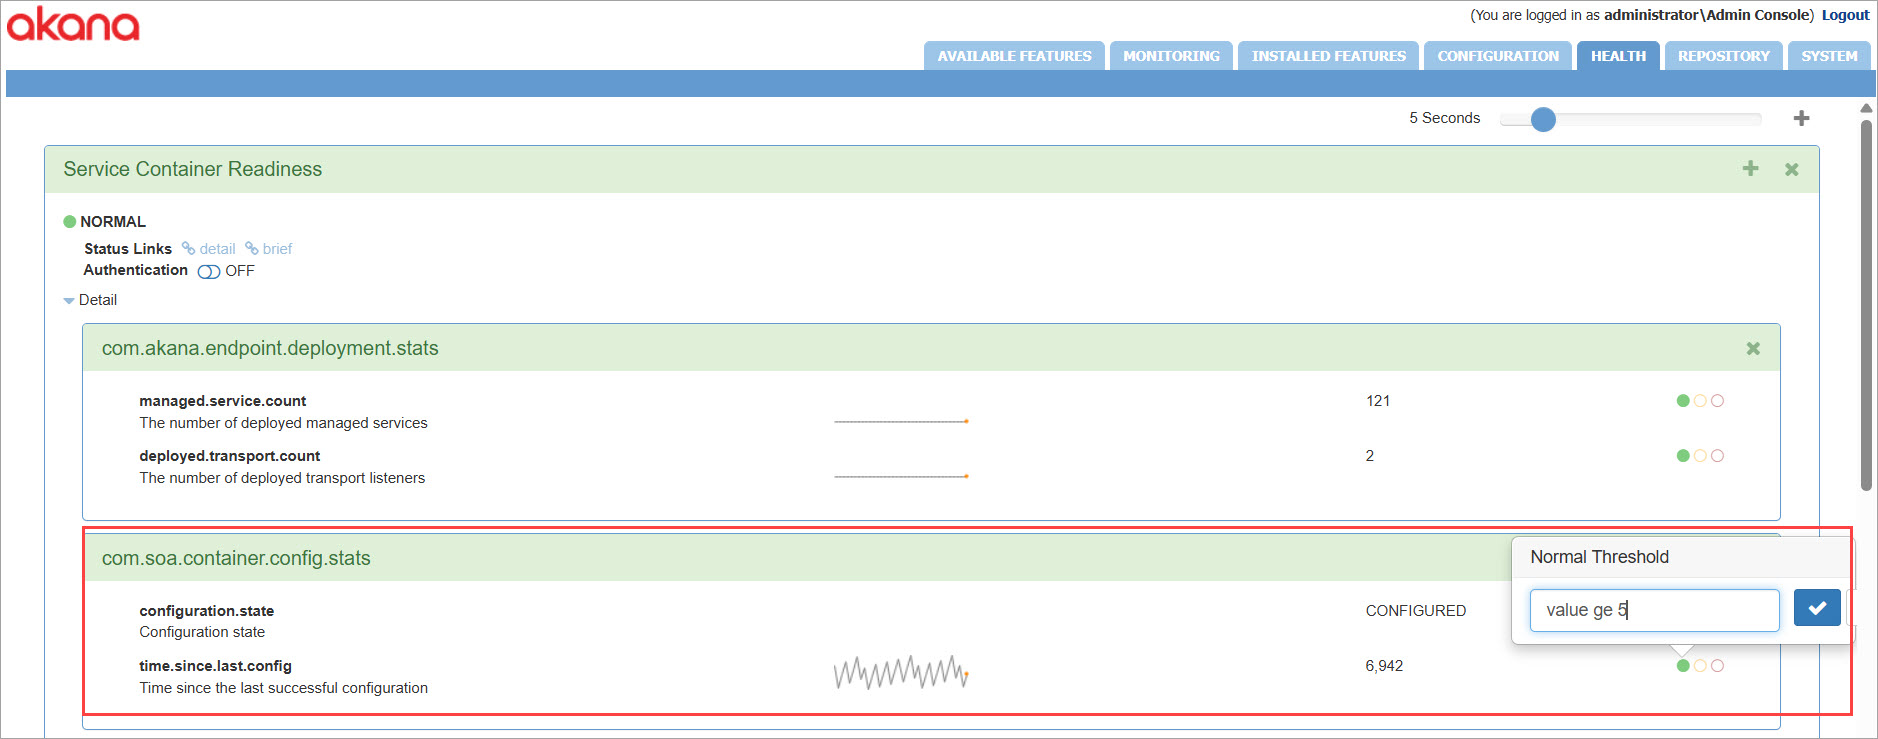
A new metric attribute, time.since.last.config, is added to the existing subpanel identified by com.soa.container.config.stats. This subpanel already includes the attribute configuration.state, which remains unchanged during the update.
A threshold is defined for the time.since.last.config by using the expression value ge 5. This means the status is considered normal when the value is below 5.
Add a custom panel with metric attributes
To add a new custom panel, click the plus (+) icon and specify a name for the panel.

To add the metric attributes, click the plus (+) icon, which opens the Select Variables window.
For example, the subpanel, com.akana.transport.messaging is added under the Custom Panel with the metric attribute message.listeners. The thresholds define the status based on the number of active message listeners.
The following threshold defines a normal condition when the value is less than10 (value lt 10), indicating an acceptable number of active listeners.

The following threshold defines a warning condition when the value is between 10 and 15 (value ge 10) and (value le 15), signaling a potential issue that requires attention.

The following threshold defines a failure condition when the value exceeds 15 (value gt 15), indicating an excessive number of active listeners that may cause problems.

System Health Tool API
You can access the API by using a GET method on /admin/health context for any Akana container.
For example, if the container Akana Administration Console URL is:
http://acme.akana.com:9900/admin
The URL for the System Health Tool API is:
http://acme.akana.com:9900/admin/health
This returns a data set, with additional links, from which you can drill down for more detailed information on some aspect of container health.
Note: The Health Monitor API returns information for a specific container. When reviewing container health, make sure you review the information for the correct container, or for all containers if needed. Note that each container might not have all the health statistics, depending on the container. For example, an ND container won’t have any DB stats as it doesn’t connect to the database.
Sample API request and response
The example below shows the request and response on system health for a container with a URL of http://acmepaymentscorp.com:7900/admin.
Request
http://acmepaymentscorp.com:7900/admin/health/measurables/akana.system.health
Response
{
  "id" : "akana.system.health",
  "name" : "System Health",
  "path" : "akana.system.health",
  "state" : "NORMAL",
  "childCount" : 2,
  "children" : [ {
    "id" : "akana.health.lifecycle",
    "path" : "akana.system.health/akana.health.lifecycle",
    "state" : "NORMAL",
    "attributes" : [ {
      "type" : "2",
      "name" : "lifecycle.state",
      "path" : "akana.system.health/akana.health.lifecycle/lifecycle.state",
      "description" : "The current system lifecycle state",
      "threshold" : {
        "normal" : "value eq 'STARTED'",
        "failure" : "value ne 'STARTED'",
        "links" : [ {
          "rel" : "self",
          "href" : "http://acmepaymentscorp.com:7900/admin/health/measurables/akana.system.health/children/akana.health.lifecycle/variables/lifecycle.state/threshold"
        } ]
      },
      "state" : "NORMAL",
      "value" : "STARTED",
      "links" : [ {
        "rel" : "self",
        "href" : "http://acmepaymentscorp.com:7900/admin/health/measurables/akana.system.health/children/akana.health.lifecycle/variables/lifecycle.state"
      } ]
    } ],
    "editable" : false,
    "links" : [ {
      "rel" : "self",
      "href" : "http://acmepaymentscorp.com:7900/admin/health/measurables/akana.system.health/children/akana.health.lifecycle"
    }, {
      "rel" : "values",
      "href" : "http://acmepaymentscorp.com:7900/admin/health/measurables/akana.health.lifecycle/values"
    } ]
  }, {
    "id" : "com.soa.vmstats",
    "path" : "akana.system.health/com.soa.vmstats",
    "state" : "NORMAL",
    "attributes" : [ {
      "type" : "1",
      "name" : "free.memory.pct",
      "path" : "akana.system.health/com.soa.vmstats/free.memory.pct",
      "description" : "The amount of available heap memory as a percentage of the max",
      "threshold" : {
        "normal" : "value ge 20",
        "warning" : "(value lt 20) and (value ge 5)",
        "failure" : "value lt 5",
        "links" : [ {
          "rel" : "self",
          "href" : "http://acmepaymentscorp.com:7900/admin/health/measurables/akana.system.health/children/com.soa.vmstats/variables/free.memory.pct/threshold"
        } ]
      },
      "state" : "NORMAL",
      "value" : 21.0,
      "links" : [ {
        "rel" : "self",
        "href" : "http://acmepaymentscorp.com:7900/admin/health/measurables/akana.system.health/children/com.soa.vmstats/variables/free.memory.pct"
      } ]
    } ],
    "editable" : false,
    "links" : [ {
      "rel" : "self",
      "href" : "http://acmepaymentscorp.com:7900/admin/health/measurables/akana.system.health/children/com.soa.vmstats"
    }, {
      "rel" : "values",
      "href" : "http://acmepaymentscorp.com:7900/admin/health/measurables/com.soa.vmstats/values"
    } ]
  } ],
  "editable" : false,
  "options" : {
    "enableAuth" : true,
    "links" : [ {
      "rel" : "self",
      "href" : "http://acmepaymentscorp.com:7900/admin/health/measurables/akana.system.health/configuration"
    } ]
  },
  "links" : [ {
    "rel" : "self",
    "href" : "http://acmepaymentscorp.com:7900/admin/health/measurables/akana.system.health"
  }, {
    "rel" : "brief",
    "href" : "http://acmepaymentscorp.com:7900/admin/health/measurables/akana.system.health?brief=true"
  }, {
    "rel" : "children",
    "href" : "http://acmepaymentscorp.com:7900/admin/health/measurables/akana.system.health/children"
  }, {
    "rel" : "options",
    "href" : "http://acmepaymentscorp.com:7900/admin/health/measurables/akana.system.health/configuration"
  }, {
    "rel" : "values",
    "href" : "http://acmepaymentscorp.com:7900/admin/health/measurables/akana.system.health/values"
  } ]
}
For an example of the request and response to a System Health tool status call, see Using Response Codes to Monitor Status: Examples in the load balancing example.
The API response provides an overview of the available health monitors (named measurables), and a set of links that provide access to more detailed information. Each of the measurables in the response corresponds to a monitoring panel shown on the Akana Administration Console.
Links in the API response
You can follow each of the links in the response to view different health dimensions as well as the configuration info. Examples:
- To get detailed information on the akana.system.health category, you would perform an HTTP GET using the self link.
- To view all the available configurable options, you can fetch http://acme.akana.com:9900/admin/health/available.
For more information about the System Health Tool API, refer to the generated documentation. See Generated API documentation.
Using query parameters to define the HTTP response status code
If the health category is NORMAL, WARNING, or FAILURE, you can use an optional set of query parameters to control the HTTP status code returned for each of the thresholds. This avoids the need to parse the JSON response content, allowing decisions to be made solely on the response code.
The following query parameters are valid for specifying response HTTP status when you run the GET operation on the health category:
- normal-status
- warning-status
- failure-status
Sample request using query parameters
In the example below, the GET call to check container readiness sets a warning status of 503 and a failure status of 503. This will return 503 until the health check is in the NORMAL state, at which point it will return 200.
GET http://acme.akana.com:9900/admin/health/measurables/akana.service.container.readiness?brief=true&warning-status=503&failure-status=503
Sample response
In the example below, the container returned HTTP 200. The response content shows that the container is in NORMAL state.
{
  "id" : "akana.service.container.readiness",
  "name" : "Service Container Readiness",
  "path" : "akana.service.container.readiness",
  "state" : "NORMAL",
  "childCount" : 3,
  "editable" : false,
  "options" : {
    "enableAuth" : true,
    "links" : [ {
      "rel" : "self",
      "href" : "http://acme.akana.com:9900/admin/health/measurables/akana.service.container.readiness/configuration"
    } ]
  },
  "links" : [ {
    "rel" : "self",
    "href" : "http://acme.akana.com:9900/admin/health/measurables/akana.service.container.readiness"
  }, {
    "rel" : "brief",
    "href" : "http://acme.akana.com:9900/admin/health/measurables/akana.service.container.readiness?brief=true"
  }, {
    "rel" : "children",
    "href" : "http://acme.akana.com:9900/admin/health/measurables/akana.service.container.readiness/children"
  }, {
    "rel" : "options",
    "href" : "http://acme.akana.com:9900/admin/health/measurables/akana.service.container.readiness/configuration"
  } ]
}
Generated API documentation
For more information about the System Health tool API, refer to the generated documentation:
- Go to REST API Documentation.
- In the Akana Platform API Documentation section (second section), choose the version for your installation.
- Choose Health Service.