Using the Admin Monitoring Tool
Learn how to monitor the real-time state of a container with the Admin Monitoring Tool, an optional plug-in.
Note: The product also includes the newer Container Health tool (Akana Administration Console for the container > Health tab), which is part of basic installation and also allows you to create your own monitoring dashboard. We recommend using the Container Health tool. See Monitoring the Health of a Container: Akana System Health Tool.
On this page:
Introduction
The Admin Monitoring Tool plug-in provides information about the real-time state of the container and can be helpful during the debugging of issues when the log files do not provide enough information. The feature adds a Monitoring tab to the Administration Console.
Container data provided by the tool includes:
- Incoming HTTP connections (com.soa.transport.httpclient)
- Database thread pool (com.soa.database.config.<db-config-id>-mon)
- Active/idle Policy Manager processes (com.soa.framework)
- Container memory usage (com.soa.vmstats)
- Outgoing HTTP connections (com.soa.transport.jetty)
- Monitoring queues (com.soa.usage)
- JMS connections (com.soa.transport.jms)
Configuration
- Launch the Administration Console.
- Select the Available Features > Tool filter, and install the Admin Monitoring Tool.
- After the installation is complete, click OK to restart the container.
- When you log back into the Administration Console, a new Monitoring tab displays.
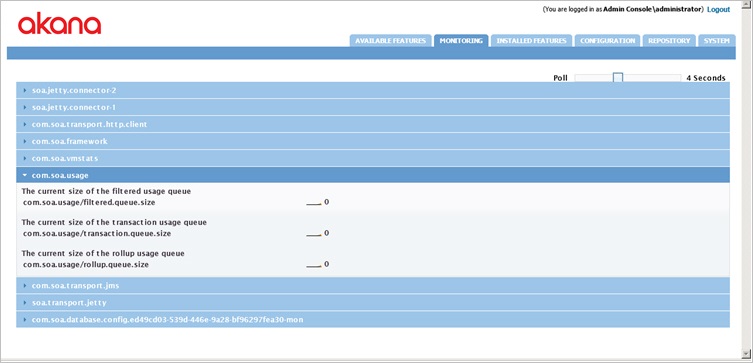
- View each monitoring category by selecting the expand/collapse control. Only one category of data can be open/viewed at a time.
- You can also configure how often the system polls for data (Off - 10 seconds).
- This tool does not require additional machine or container resources to run. Before closing the tool, set the polling interval to 0.