Using the Operational Metrics Policy
Version 2020.1.1: The Operational Metrics Policy, which the Operational Metric dataset uses, is deprecated in version 2020.1.1. Do not use the Operational Metric dataset. Instead, create a new dataset and use the Business Metrics policy.
Versions prior to 2020.1.1: Learn how to collect numeric data relating to service request/response time and by contract, subject, and client region that can be visualized in charts using an Operational Metrics Policy, including a use case.
Learn how to collect numeric data relating to service request/response time and by contract, subject, and client region that can be visualized in charts using an Operational Metrics Policy, including a use case.
This policy is used with the Envision product and is installed as part of the Envision Console Extension Feature.
For information about using policies in the context of the Community Manager developer portal, see Business Policies.
On this page:
- Introduction
- Configuration
- Activating a policy
- Attaching a policy
- Use case: Generating a Chart from Operational Metrics Obtained from Service Operational Data
Introduction
The Operational Metrics Policy allows you to specify what operational metrics should be gathered. It differs from an auditing policy in that metrics are only numeric values that can be charted; they contain no information about the content of the message.
Instead of collecting all metrics, data capture can be performed at a more granular level to serve specific reporting requirements. For example, you might want to monitor where the maximum API traffic is coming from based on a service, organization, operation, license, binding type, and so forth to determine the best location for your data center. With this policy you can configure the collection of a specific metric type and can also filter the data capture based on a specific dimension.
Metrics
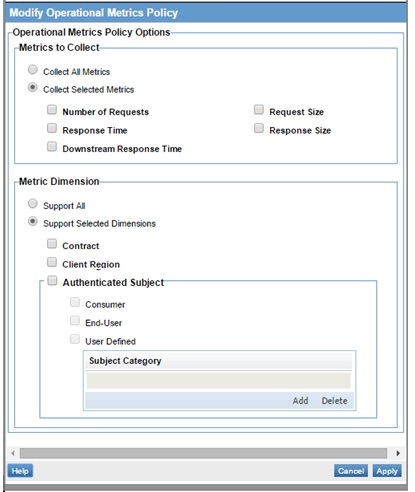
You can enable the collection of all or selected metrics types. Options include:
- Collect All Metrics: Enables collection of all metrics types.
- Collect Selected Metrics: Enables the collection of selected metrics types.
Supported metrics types include:
- Numbers of Requests
- Response Time
- Downstream Response Time
- Request Size
- Response Size
Dimensions
You can enable the collection of all or selected dimensions. Options include:
- Support All: Enables collection of all dimension types.
- Support Selected Dimensions: Enables the collection of selected dimension types.
Supported dimension types include:
- Client Region
- Contract
- Authenticated Subject: This option allows you to state whether or not you want the authenticated subject (User) to be audited. You then select the category of user to audit. Predefined categories include Consumer, End-User, and User Defined. If you choose User Defined, you can specify a custom category name, as shown below.
Configuration
For a complete walk-through tutorial on adding and configuring an Operational Metrics Policy, generating audit and log data for a virtual service, and using this data in the Envision Console to generate a variety of different charts, refer to Use case: Generating a Chart from Operational Metrics Obtained from Service Operational Data below.
Activating a policy
When you create and configure a policy, the policy is in Draft state. When the policy configuration is complete, activate the policy: click Activate Policy and then confirm. See Activate a Policy.
A policy in Draft state is not available for general use. Once you activate the policy, it is in Active state and is available for use.
Attaching a policy
To use the policy, go to the Policies folder in the respective organization and attach the policy to a web service, binding, or binding operation.
Use case: Generating a Chart from Operational Metrics Obtained from Service Operational Data
The following use case illustrates how to generate a chart from Operational Metrics obtained from Service Operational Data.
Configuration
- Perform the Policy Manager / Envision Integration Installation. At the end of this process you will have configured Envision, Policy Manager, and Network Director container instances. This process also includes using Add Container in the Policy Manager Management Console to register the Network Director container.
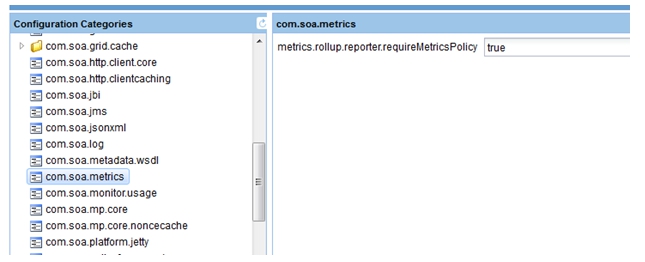
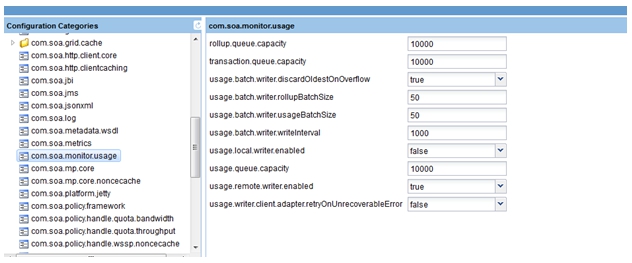
- Launch the Akana Administration Console for the Network Director container instance, and change the following configuration properties via the Configuration tab:
- com.soa.metrics: metrics.rollup.reporter.requireMetricsPolicy set to true.
- com.soa.monitor.usage: set values as shown below.
- com.soa.metrics: metrics.rollup.reporter.requireMetricsPolicy set to true.
- Restart the Network Director container instance.
- Launch the Policy Manager Management Console and create a physical service using the file at this URL: http://petstore.swagger.io/v2/swagger.json.
- Select Virtualize Service, and virtualize the physical service in the Network Director container.
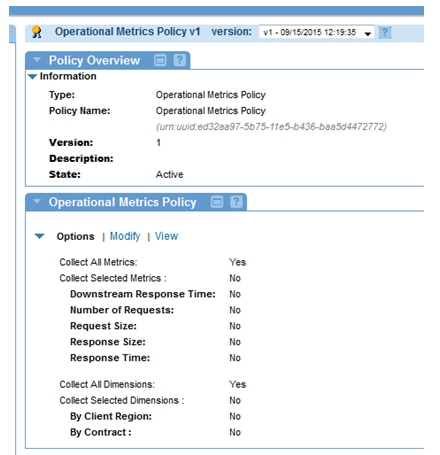
- Go to Policies > Operational and use Add Policy to create an Operational Metrics Policy and configure it based on the illustration below.
- Attach a Detailed Auditing Policy (found in the root Policies folder) and an Operational Metrics Policy to the virtual service.
- Send requests to the virtual service.
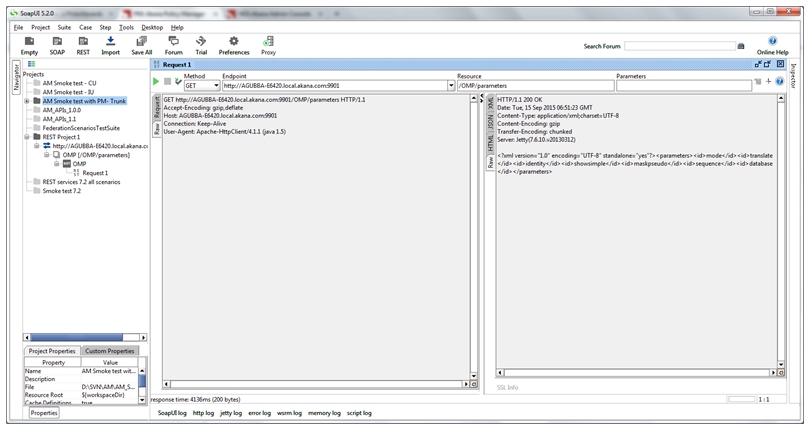
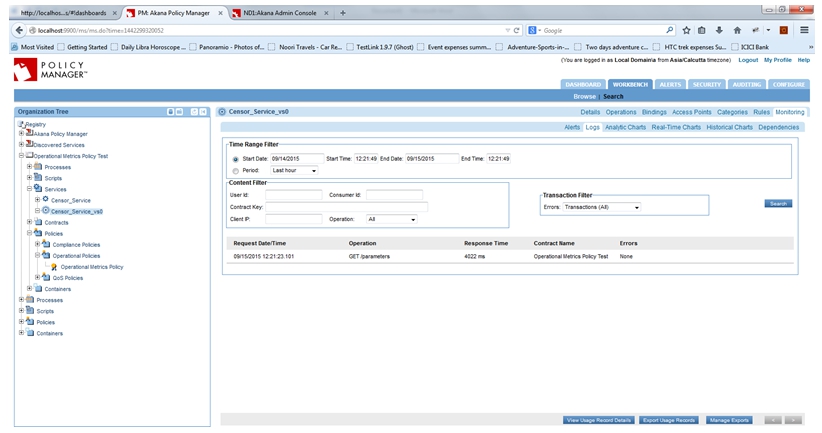
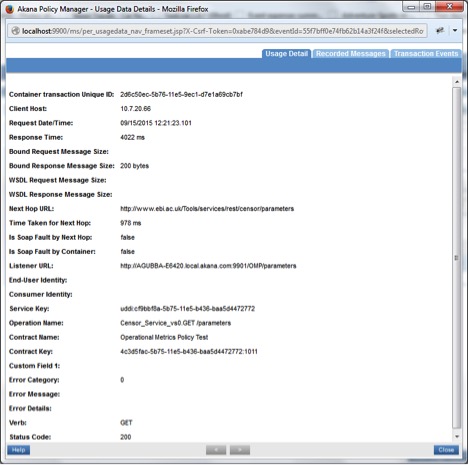
- View the usage logs for the service.
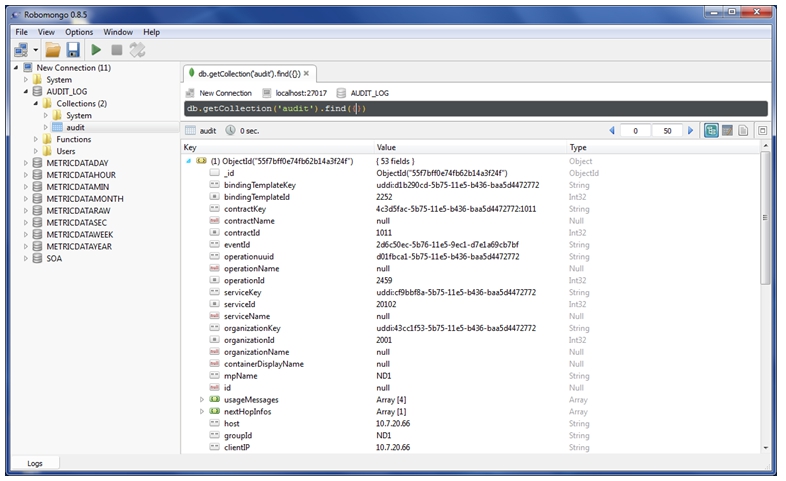
- View the recorded logs in MongoDB in the AUDIT_LOG collection.
- METRICDATASEC should be aggregating the logs per second. To see this, view the following collections: API Operational Metric Dataset, API Contract Metric Dataset, and API User Metric Dataset.
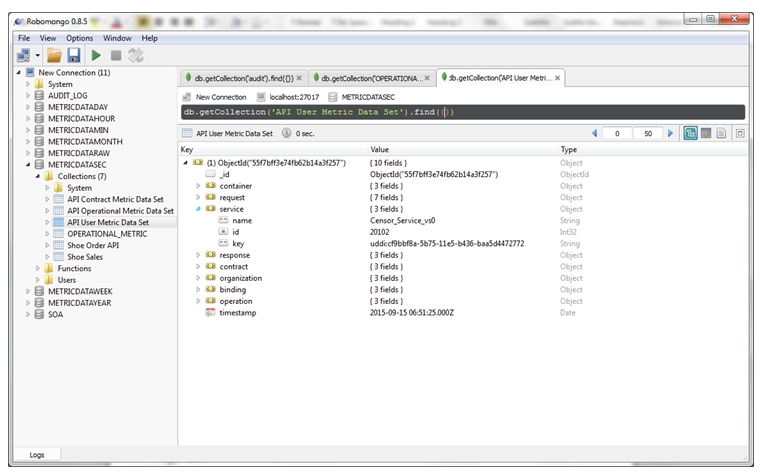
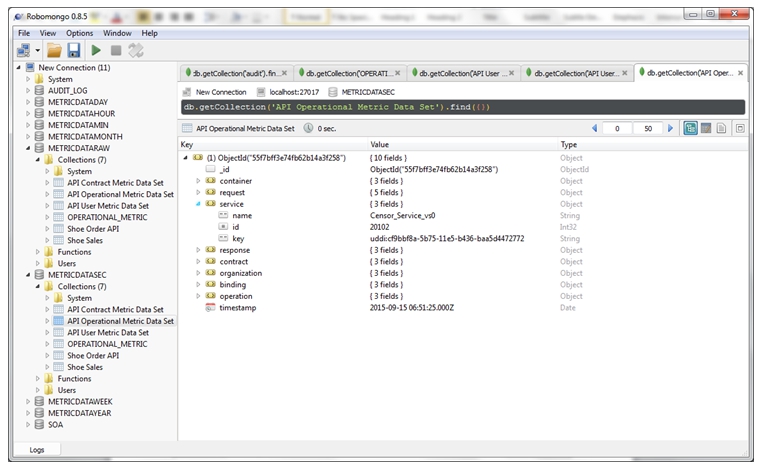
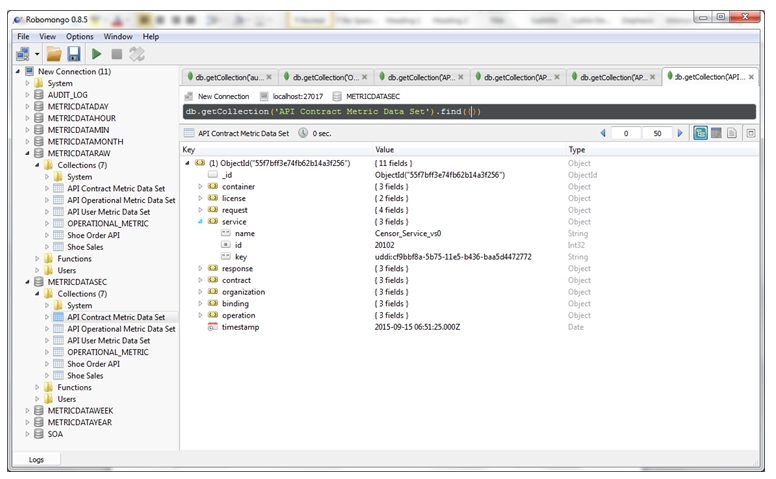
- METRICDATAMIN should be aggregating the logs per minute on the basis of METRICDATASEC. To see this, view the following collections: API Operational Metric Dataset, API Contract Metric Dataset, and API User Metric Dataset.
- Send requests to various operations.
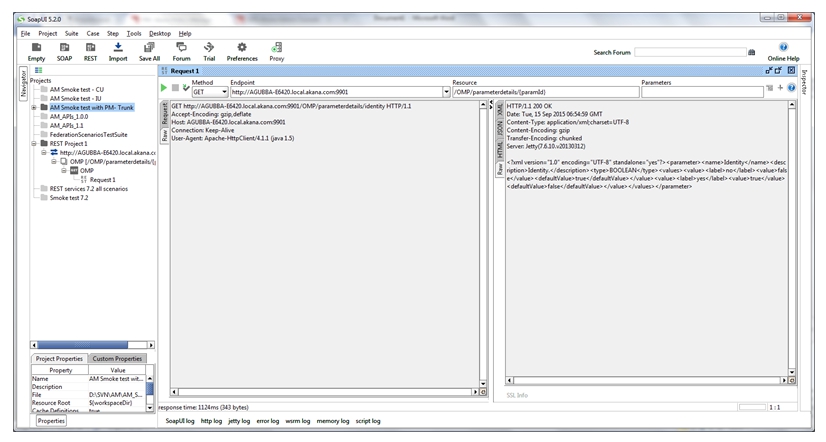
- View the usage logs in MongoDB. The logs should contain the fields and information as per the Operational policy configuration made above
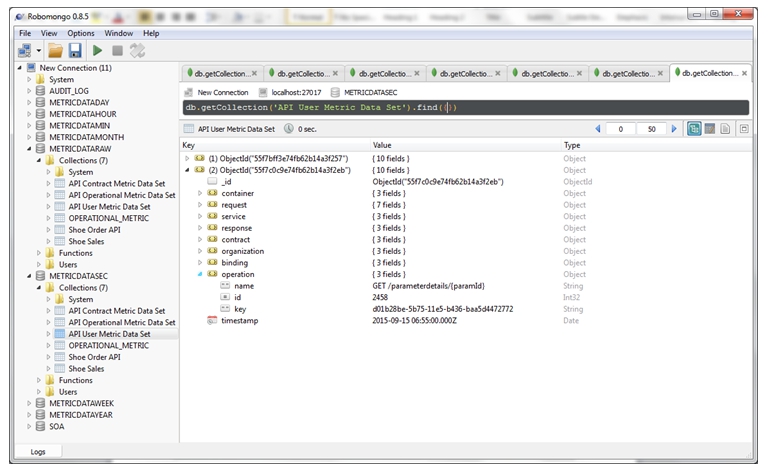
-
Launch the Envision Console and make a chart using the collections API Operational Metric Dataset, API Contract Metric Dataset, and API User Metric Dataset. The charts should show appropriate data:
- API Operational Metric Dataset
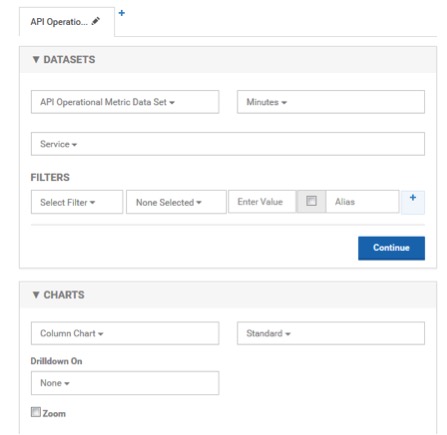
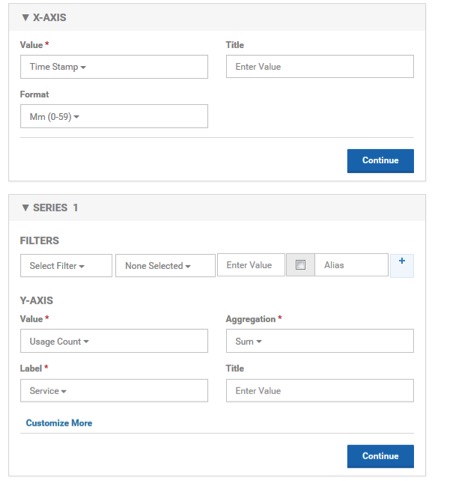
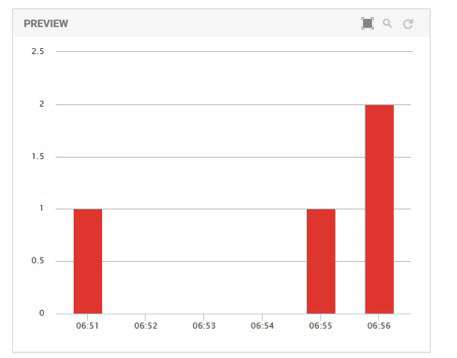
- API Operational Metric Dataset
- In the same way, verify charts for the API Contract Metric Dataset and API User Metric Dataset.