Policy Manager / Envision Integrated Installation
Learn how to install Envision with Policy Manager and Network Director.
On this page:
Installation Procedure: New installation
- Introduction
- Reference Documentation
- Set up MongoDB
- Install Akana Platform
- Install and Configure Envision
- Install and Configure Akana API Platform (for Policy Manager)
- Configure Network Director
- Step 1: Create Network Director Container
- Step 2: Install the Network Director Feature
- Step 3: Configure Network Director
- Step 4: Install the Envision Metrics Collector Plug-in
- Step 5: Modify Usage Writer Properties
- Step 6: Register Network Director Container
- Step 7: Host Virtual Services in Network Director Container
- Launch Envision Console
Installation Procedure: Adding Envision to an existing installation
Installation Tasks/Reference:
Installation Procedure: Completely new installation
Introduction
Integrating Policy Manager with the Envision 1.2 analytics and monitoring solution allows you to take advantage of the Policy Manager policies related to business metrics. These policies are plug-in extensions to the Policy Manager Management Console, and provide support for capturing business metrics data (that is, usage data and logs for a selected dataset). This data is then fed into the Envision product and can be used to generate statistical reports about API/service usage.
The integration requires:
- Installation and setup of a MongoDB database.
- Installation of the Akana Platform.
- Installation of the corresponding version (same release number) of the PM Analytics Plugin.
- Installation Akana API Platform and configuration of Policy Manager and Network Director.
- Installation and configuration of the Envision feature using the Akana Administration Console.
In this installation scenario, you'll configure three container instances:
- Envision
- Policy Manager
- Network Director
Each container instance must have a unique port number.
You have the option to use a different container configuration scenario based on your requirements.
Reference Documentation
For detailed instructions of common tasks, refer to the reference topics below.
Containers:
- Configure Standalone Container
- Container Deployment Options
- Starting and Stopping a Container Instance
Policy Manager:
Network Director:
Set up MongoDB
Step 1: Download and Install MongoDB
- Go to http://www.mongodb.org/downloads and download the MongoDB file for your platform. Windows 64-bit (MSI), Linux 64-bit (TGZ), and Solaris 64-bit (TGZ) are supported. If you are on a Mac, you can install Mongo with homebrew using brew install mongo.
- Install MongoDB on your platform.
Note: these instructions provide a basic MongoDB installation approach. For information on installation instructions and shutdown procedures for your specific deployment, refer to the MongoDB documentation, available at https://docs.mongodb.com.
Step 2: Create MongoDB Data Folder
- Create a MongoDB data folder. The default is /data/db. If you prefer to use a different location, use --dbpath.
Step 3: Start MongoDB
- Navigate to the MongoDB installation directory: for example, /MongoDB/3.6/bin.
- Enter mongod.
- If MongoDB successfully starts, your command window displays waiting for connections followed by the port number.
Note (Linux only): Once you've started MongoDB, you might need to run the fork command to keep it running in the background while you complete the other installation steps. logpath sets the path for the log. For example: mongod -fork -logpath /opt/mongodb/mongod.log.
Step 4: Database and Container Shutdown Procedure
When shutting down your Envision system, it's important to shut down the Envision container and the MongoDB database in the following sequence to avoid data loss and/or the requirement of performing data repair.
- First, shut down the container. Refer to Starting and Stopping a Container Instance for shutdown options.
- Then, shut down the MongoDB container. For information on installation instructions and shutdown procedures for your specific deployment, refer to the MongoDB documentation, available at https://docs.mongodb.com/.
Install Akana Platform
Step 1: Install Akana Platform
Envision and Policy Manager must both be installed to the Akana Platform.
For detailed instructions, refer to the installation instructions corresponding to your Akana Platform version. Go to Installing the Akana API Platform.
If the Akana Platform is already installed, skip to the next step.
Install and Configure Envision
Step 1: Download Envision ZIP File
The Envision ZIP file must be installed to the Akana Platform. Download the Envision self-extracting ZIP file from the Akana Support Portal.
For instructions, see Installation files (Envision installation doc).
Step 2: Install Envision ZIP File
- Extract the Envision ZIP file to a subfolder within the Akana platform folder: for example, aap84/envision.
Step 3: Configure Envision Container
The Envision feature is typically installed into a Standalone container.
- Launch the Configure Container Instance Wizard. Navigate to the Platform release directory (\{release_directory}\bin) and start the container, using one of the following:
- Windows: startup.bat configurator
- UNIX: startup.sh configurator
- Select the Standalone Deployment option and complete the configuration.
For detailed instructions, see Configure Standalone Container. For a complete list of options, see Container Deployment Options.
Step 4: Install and Configure Envision Feature
- Launch the Akana Administration Console (http://{hostname}:{port}/admin/).
- Select the Repository tab and click Refresh. The Akana Envision Repository is displayed.
- On the Available Features screen, from the Filter menu at the top left, select Feature.
- Select the Akana Envision feature and then click Install Feature.
- After the installation is complete, click Configure and continue.
- On the Configure MongoDB Database screen, in the MongoClientURI field, specify the host name and port where the MongoDB database is installed. The default MongoDB port is 27017.
- Click Finish. The URI is assigned, and the system automatically configures seed data and adds schemas.
- Click Cancel on the container restart message, then click Close on the summary screen and continue to the next step.
Step 5: Install and Configure Sample Datasets
Install the Akana Sample Datasets for Demo Charts plug-in. For instructions, see Step 5: Install and Configure Sample Datasets in the Envision installation documentation.
- On the Available Features screen, from the Filter menu at the top left, select Plug-ins.
- Select the Akana Sample Datasets for Demo Charts plug-in, and click Install Feature.
- After installation is complete, click Configure and continue.
- On the Configure Sample Datasets screen, select the checkbox for each dataset you want to install.
- Click Finish, and then click OK to restart the container.
- When the restart is complete, click Close.
Note: After the installation is compete, you can manage (install / uninstall) datasets via the Configuration tab by selecting Configure Sample Datasets.
The next step is to install and configure Policy Manager.
Install and Configure Akana API Platform (for Policy Manager)
Step 1: Download Akana API Platform ZIP File
The Akana API Platform ZIP file contains all necessary files for Akana API Platform installation, including Policy Manager and Community Manager installation.
- Log in to the Akana Support Portal.
- In the My Resources section, click Product Downloads, and then click Akana - Product Downloads.
- Click the link for the version you are installing.
- Download the Akana API Platform GA ZIP file.
Step 2: Install Akana API Platform ZIP File
- Extract the Akana API Platform ZIP file to the Akana platform folder.
Step 3: Configure Policy Manager Container
- Launch the Configure Container Instance Wizard. Navigate to the Akana Platform release directory (\{release_directory}\bin) and start the container, using one of the following:
- Windows: startup.bat configurator
- UNIX: startup.sh configurator
- Select the Standalone Deployment option and complete the configuration.
For detailed instructions, see Configure Standalone Container. For a complete list of options, see Container Deployment Options.
Step 4: Install and Configure Policy Manager Services and Console Features
- On the Available Features page, select the following features:
- Policy Manager Services
- Policy Manager Console
- Click Install Features.
- Complete the installation and configuration. For detailed instructions on installing these features, refer to the Reference Documentation for Policy Manager.
- On the container restart message, click Cancel, and then, on the summary screen, click Close.
- Continue to the next step.
Step 5: Install Envision Console Extensions Plug-in
- On the Available Features screen, from the Filter menu at the top left, select Plug-ins.
- Select the Envision Console Extensions plug-in and click Install Feature. Note that this feature also installs the Envision Service Extensions Feature.
- After the installation is complete, click Configure and continue.
- On the Configure MongoDB Database screen, in the MongoClientURI field, specify the host name and port where the MongoDB database is installed. The default MongoDB port is 27017.
- Click Finish. The URI is assigned, and the system automatically configures seed data and adds schemas.
- After the installation is complete, Click Finish, and then click OK to restart the container.
- When the restart is complete, click Close.
Configure Network Director
For detailed instructions on installing and configuring Network Director, refer to the Reference Documentation for Network Director.
Because this is a custom configuration, note that you must add Step 4: Install the Envision Metrics Collector Plug-in and Step 5: Modify Usage Writer Properties to your configuration sequence.
Step 1: Create Network Director Container
- Launch the Configure Container Instance Wizard. Navigate to the Platform release directory (\{release_directory}\bin) and start the container, using one of the following:
- Windows: startup.bat configurator
- UNIX: startup.sh configurator
- Select the Standalone Deployment option and complete the configuration.
For detailed instructions, see Configure Standalone Container. For a complete list of options, see Container Deployment Options.
Step 2: Install the Network Director Feature
- Launch the Akana Administration Console (http://{hostname}:{port}/admin/).
- On the Installed Features screen, select the Network Director feature and click Install Feature.
- After the installation is complete, click Configure and continue to the next step.
Step 3: Configure Network Director
- As part of the Network Director configuration, specify the WS-MetadataExchange URL and configure keys. The Generate PKI Keys & X.509 Certificate option is the most commonly used default option.
- Click Finish.
- Click Cancel on the container restart message, then click Close on the summary screen and continue to the next step.
Step 4: Install the Envision Metrics Collector Plug-in
Note: If the Network Director feature is installed directly to the Policy Manager container, skip this step. The Envision Metrics Collector feature is installed as part of the Envision Policy Manager Console Extensions features that is installed as part of the Policy Manager container configuration.
- On the Available Features screen, from the Filter menu at the top left, select Plug-ins.
- Select the Envision Metrics Collector Feature plug-in and click Install Feature.
- After the installation is complete, click Cancel on the container restart message, then click Close on the summary screen and continue to the next step.
Step 5: Modify Usage Writer Properties
- Click the Configuration tab.
- In the Configuration Categories section, navigate to the com.soa.monitor.usage configuration category.
- Set the usage.local.writer.enabled property to false.
- Set the usage.remote.writer.enabled property to true.
- Click Apply Changes.
- Restart the container.
Step 6: Register Network Director Container
- Log in to the Policy Manager Management Console (http://{hostname}:{port}/ms/index.do/), and navigate to Organization > Containers.
- On the Containers Summary screen, click Add Container.
- Specify the container type, container metadata, add metadata certificate to trusted CA (if applicable), and container details.
- Complete your entries and click Finish.
- Click Close. The Container Details page for the Network Director is displayed.
Step 7: Host Virtual Services in Network Director Container
- Navigate to Containers > Hosted Services and then click Host Virtual Service.
- On the Select Virtual Service screen, select a virtual service from the Organization tree, and map one or more bindings from the selected virtual service to the access points of the current container.
Launch Envision Console
Step 1: Launch Envision Console
- Log in to the Envision Console using the username and password you defined for your Envision container: http://{hostname}:{port}/analytics/login.
- Click the Dashboards tab, and then select a dashboard from the drop-down menu. an example is shown below.

Note: If you do not see the datasets, and/or have problems logging in to the Envision Console, restart the Envision container and refer to Step 3: Start MongoDB for instructions on how to start MongoDB.
Step 2: Review Envision Reference Guide
To learn about Envision functionality and how to configure various monitoring scenarios, refer to Envision Reference.
Installation Procedure: Adding Envision to an existing installation
Prerequisites
You'll need the following:
Akana Policy Manager/Envision ZIP files. For example:
- akana-pm-envision-8.0.219.zip
- akana-envision-1.2.2470.zip
MongoDB (for example, MongoDB Community 3.6)
Existing Policy Manager installation: Steps for installing Envision
The steps below assume an existing installation with the Akana MongoDB Support plugin enabled for all Akana containers.
These steps are for manual installation of the Envision feature. If you want to use the automation script to enable this feature, please consult with your Akana Professional Services representative.
- Unzip akana-pm-envision-8.0.219.zip and akana-envision-1.2.2470.zip to Akana installation folder for all Akana instances. For example: /opt/akana_sw/sm8.
- Choose one Policy Manager container for installation of Envision. It must be installed directly on one of the PM containers.
- Restart the designated Policy Manager container.
- After restart, you'll see the following Envision features in the Akana Administration Console for the container:
- Akana Envision Metrics Collector
- Akana Envision
- Akana Envision Policy Manager Service Extensions
- Akana Envision Policy Manager Console Extensions
- Akana Policy Manager Analytics Security Provider
- Akana Sample Datasets for Demo Charts
- Install all the features above and then restart the container.
- Repeat steps 3 through 5 above for the other Policy Manager containers. However, on these Policy Manager containers, after the first, you'll need to install only the following features:
- Akana Envision Metrics Collector
- Akana Envision Policy Manager Service Extensions
- Akana Envision Policy Manager Console Extensions
- Repeat steps 3 through 5 above for all other containers, such as Community Manager or Network Director containers. For non-PM containers, install only the following feature:
- Akana Envision Metrics Collector
- Log in to the Envision portal running on http://{PM/Envision URL}/analytics.
Data aggregation for Envision requires PM rollup time zone to match Envision time zone setting. See below screenshot for reference.
Installation Tasks/Reference:
Database and Container Shutdown Procedure
When shutting down your Envision system, it's important to shut down the Envision container, and MongoDB database in the following sequence to avoid data loss and/or the requirement of performing data repair.
- First, shut down the container. Refer to Starting and Stopping a Container Instance for shutdown options.
- Then, shut down the MongoDB container. For information on installation instructions and shutdown procedures for your specific deployment, refer to the MongoDB documentation, available at https://docs.mongodb.com/.
Configuration Action: Configure Envision Time Zone
Data aggregation for Envision requires that you set up a Policy Manager rollup time zone to match the Envision time zone setting. When Envision retrieves data for a chart, it selects only records that match exactly the time zone set in this configuration action. If the Envision time zone isn't set, or is set incorrectly, charts might include data for an incorrect time period, or might not show any data at all, because of time zone differences.
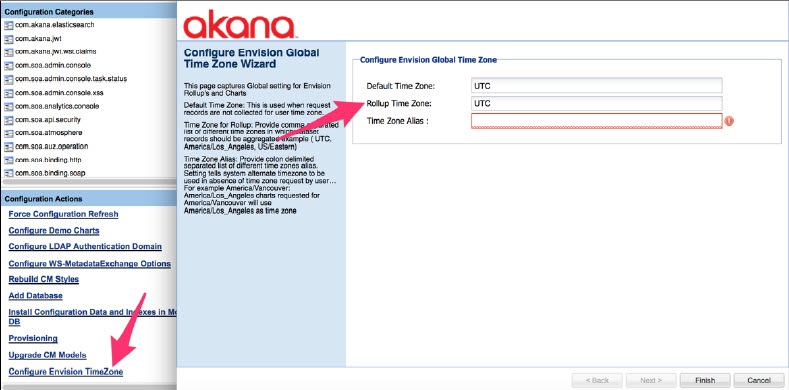
Set the Default Time Zone, Rollup Time Zone, and Time Zone Alias, as needed.